Multifamily Housing
2207 64th Avenue Oakland, CA 94605
2207 64th Avenue Oakland, CA 94605
Details & Description
Property Highlights
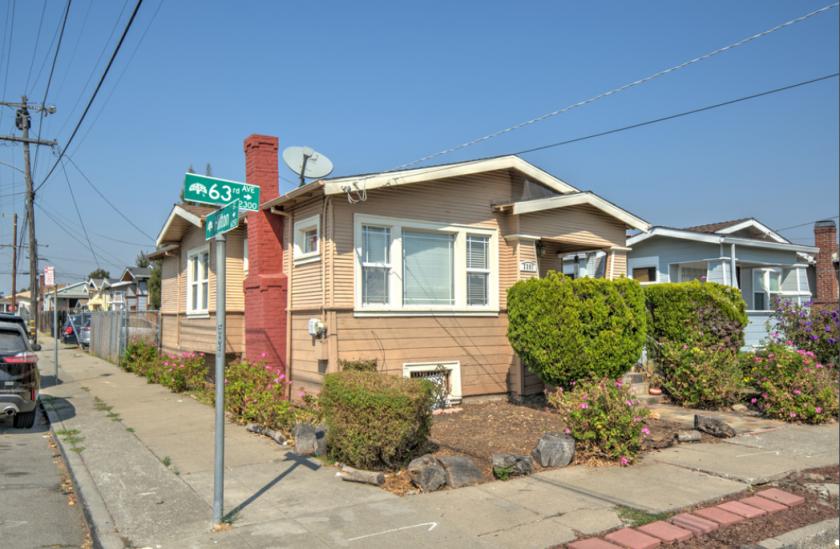
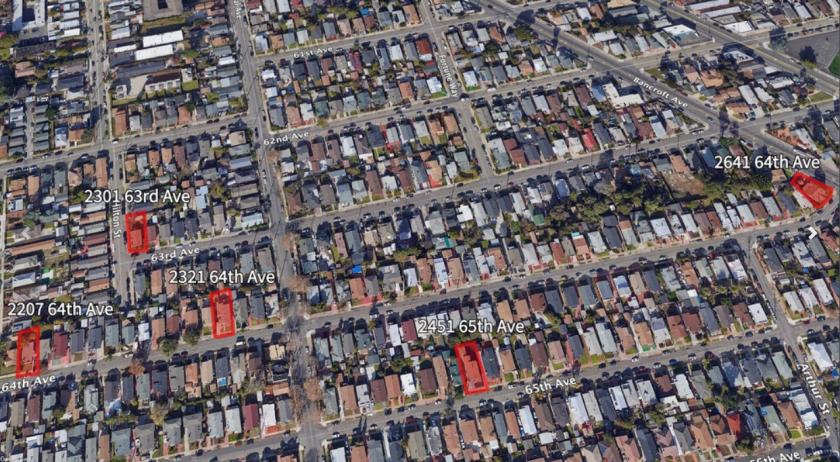
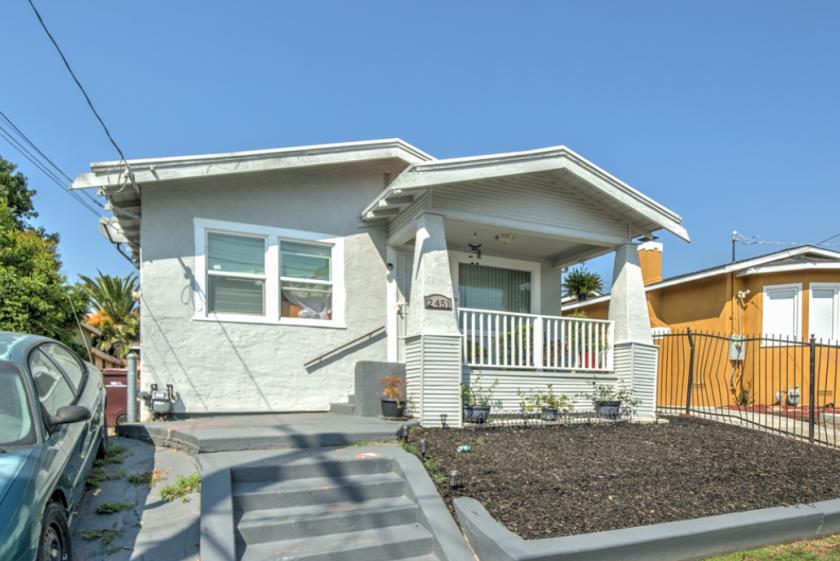
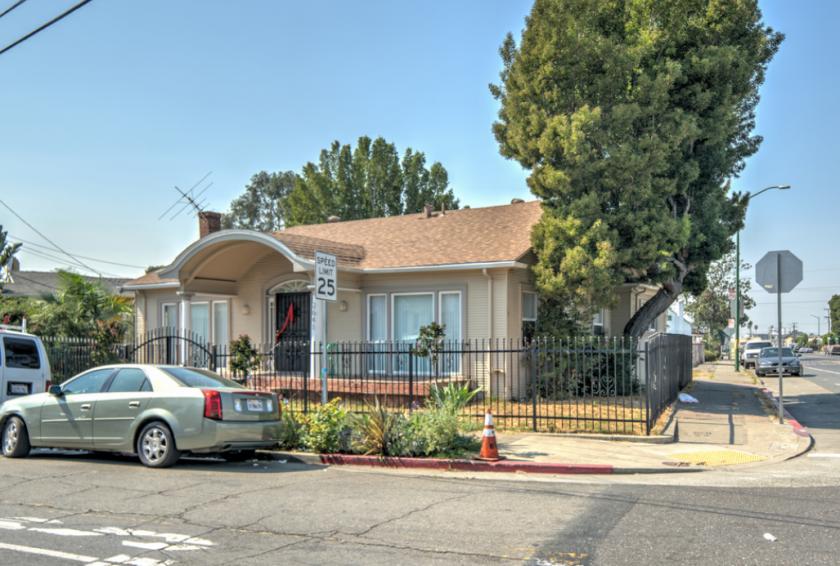
• Five individual single-family homes located within a two-block radius
• Close proximity to Coliseum BART station and city bus lines
Additional Photos

Listing Agents

Kent Mitchell
O: 510-548-2554
M: 510-919-4919
kent@nainorcal.com
O: 510-548-2554
M: 510-919-4919
kent@nainorcal.com

Tim Warren
O: 510-336-4719
M: 707-363-2463
twarren@nainorcal.com
O: 510-336-4719
M: 707-363-2463
twarren@nainorcal.com

Randell Silva
O: 510-244-4667
M: 209-740-1251
rsilva@nainorcal.com
O: 510-244-4667
M: 209-740-1251
rsilva@nainorcal.com
While we strive to provide the most accurate information, all listing information, and demographic data, is provided by third-parties. As such, MyEListing will not be responsible for the accuracy of the information. It is strongly recommended that you verify all information with the listing agent, and any relevant agencies, prior to making any decisions.


