Commercial Land
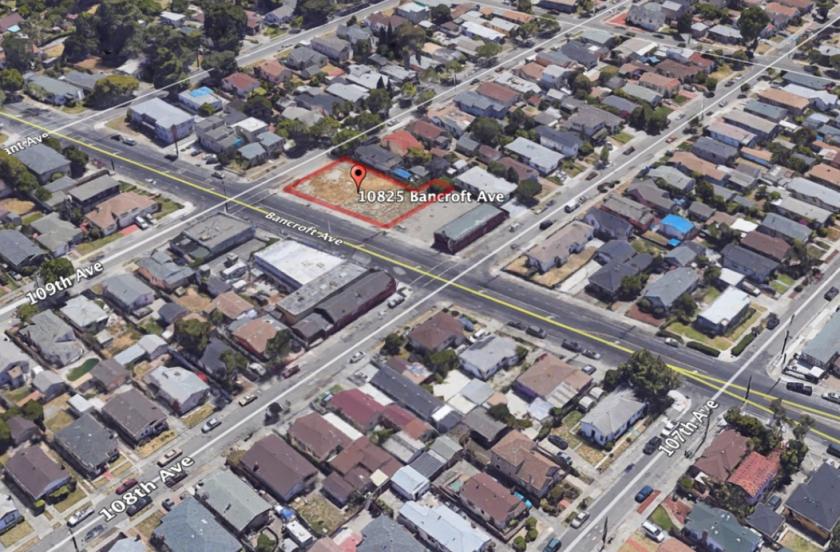
10825 Bancroft Avenue Oakland, CA 94603
10825 Bancroft Avenue Oakland, CA 94603
Details & Description
Property Highlights
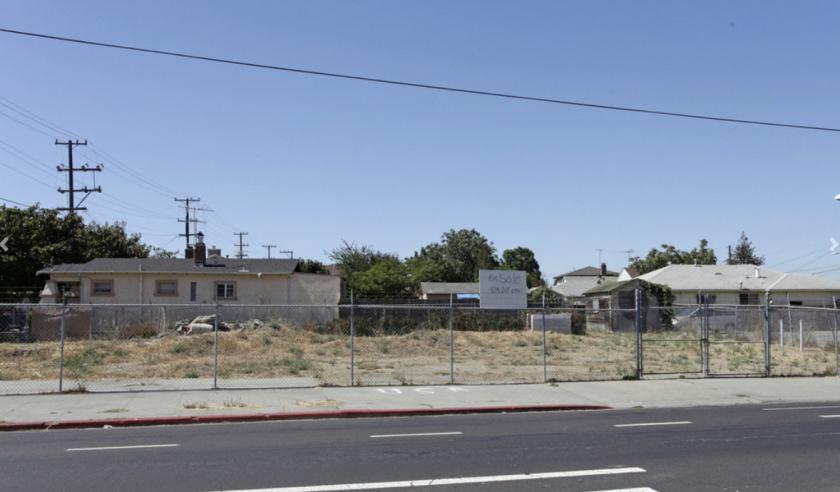
- • Property Size is 10,887 SF total
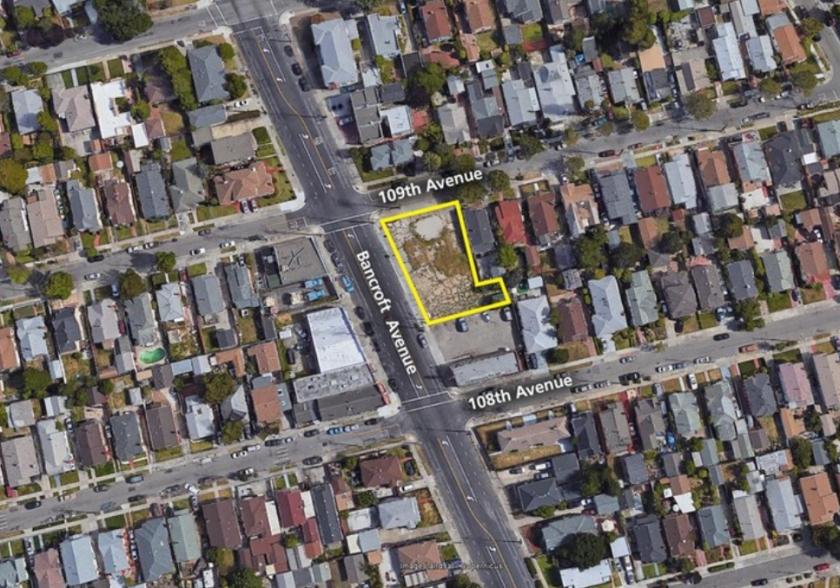
- • Fantastic corner lot
- • Existing retail right across the street
- • Zoned CN-4 for multifamily or retail development
- • Great frontage on a main thoroughfare
- • Improving area ready for new development
Listing Agents

Kent Mitchell
O: 510-548-2554
M: 510-919-4919
kent@nainorcal.com
O: 510-548-2554
M: 510-919-4919
kent@nainorcal.com

Tim Warren
O: 510-336-4719
M: 707-363-2463
twarren@nainorcal.com
O: 510-336-4719
M: 707-363-2463
twarren@nainorcal.com

Randell Silva
O: 510-244-4667
M: 209-740-1251
rsilva@nainorcal.com
O: 510-244-4667
M: 209-740-1251
rsilva@nainorcal.com
While we strive to provide the most accurate information, all listing information, and demographic data, is provided by third-parties. As such, MyEListing will not be responsible for the accuracy of the information. It is strongly recommended that you verify all information with the listing agent, and any relevant agencies, prior to making any decisions.