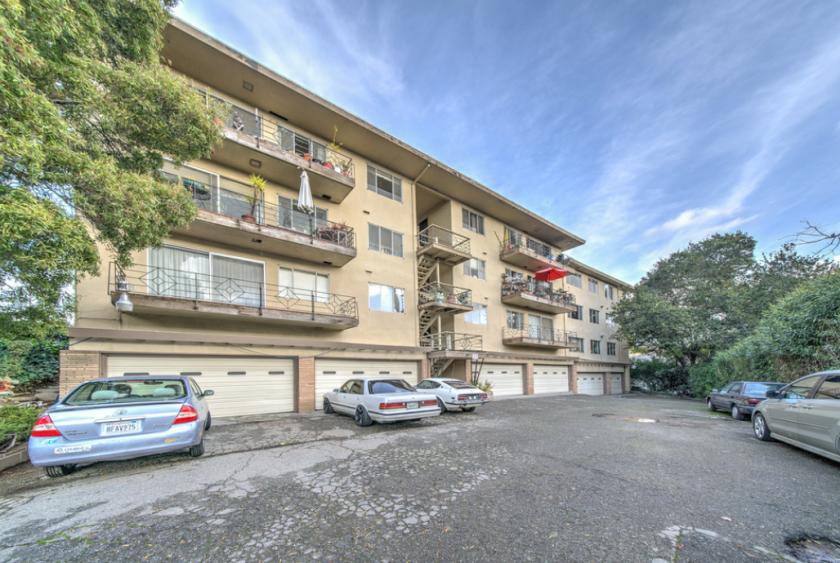
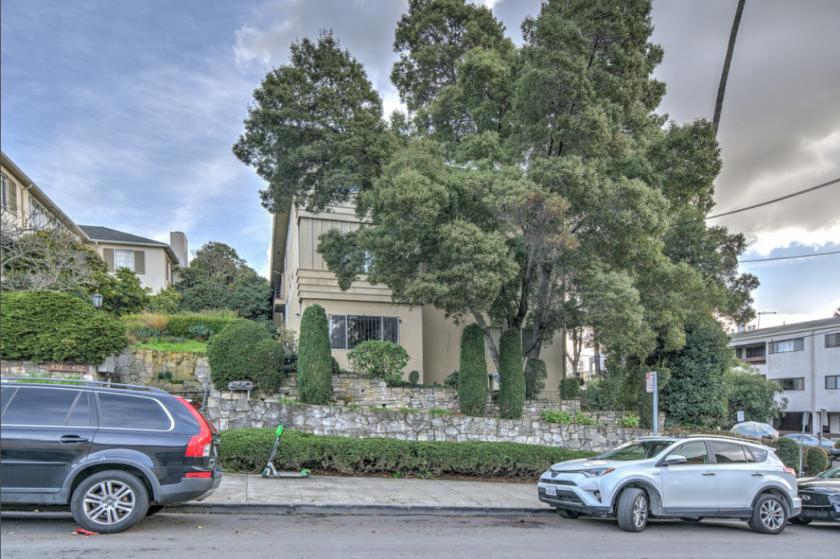
1-Mile | 3-Miles | 5-Miles | ||
---|---|---|---|---|
Total Population | 59,277 | 310,836 | 566,854 | |
Population Median Age | 41 | 39 | 38 | |
Population by Age | 0-9 Yrs | 4387 (7%) | 31712 (10%) | 56189 (9%) |
10-19 Yrs | 3290 (5%) | 27507 (8%) | 60079 (10%) | |
20-29 Yrs | 9887 (16%) | 49283 (15%) | 98881 (17%) | |
30-39 Yrs | 14149 (23%) | 59200 (19%) | 98938 (17%) | |
40-49 Yrs | 8611 (14%) | 45310 (14%) | 77341 (13%) | |
50-59 Yrs | 6404 (10%) | 36929 (11%) | 64727 (11%) | |
60-69 Yrs | 6527 (11%) | 32456 (10%) | 59075 (10%) | |
70+ Yrs | 6023 (10%) | 28440 (9%) | 51623 (9%) | |
Median HH Income | $77,781 | $79,385 | $82,491 | |
Total Household Income | < 24K | 5394 (18%) | 24244 (19%) | 41507 (18%) |
25-49K | 4457 (15%) | 20034 (15%) | 34038 (15%) | |
50-74K | 4466 (15%) | 16946 (13%) | 29170 (13%) | |
75-99K | 3864 (13%) | 14237 (11%) | 24740 (11%) | |
100-199K | 7739 (26%) | 31629 (24%) | 57356 (25%) | |
200K+ | 3574 (12%) | 20354 (15%) | 37448 (16%) | |
Highest Education Level | No Diploma | 5279 | 33453 | 50933 |
Diploma or GED | 5594 | 31247 | 51124 | |
Some College | 6555 | 36963 | 64330 | |
Assoc. Degree | 2787 | 13929 | 23584 | |
Bachelors Degree | 16734 | 69522 | 122522 | |
Higher Degree | 12290 | 50407 | 95478 | |
Total Housing Units | 31,525 | 136,245 | 240,150 | |
--Owner-Occupied | 6,599 | 45,020 | 90,635 | |
--Renter-Occupied | 22,893 | 82,425 | 133,625 | |
Owner-Occupied Values | < 100K | 119 | 822 | 1618 |
100-199K | 90 | 717 | 1530 | |
200-299K | 328 | 1495 | 3755 | |
300-399K | 498 | 2939 | 6673 | |
400-499K | 772 | 3932 | 7913 | |
500K+ | 4793 | 35114 | 69147 | |
Total Working Age Population | 52,492 | 261,337 | 478,589 | |
In Work Force | 39,338 | 183,641 | 323,826 | |
Not In Work Force | 13,153 | 77,696 | 154,763 | |
Workforce Employed | 37,478 | 172,888 | 305,190 | |
Workforce Unemployed | 1,840 | 10,084 | 17,321 | |
Civlian Workforce | 39,318 | 182,972 | 322,510 | |
Military Workforce | 20 | 668 | 1,315 | |
Total Households | 29,492 | 127,445 | 224,260 | |
Family Households | 11,262 | 64,508 | 114,587 | |
Non-Family Households | 18,230 | 62,937 | 109,673 | |
Married Couple | 8,371 | 45,210 | 80,684 | |
Other Family | 2,891 | 19,298 | 33,903 | |
Married w/Child | 2,972 | 18,974 | 33,637 | |
Single Male w/Child | 270 | 2,068 | 3,441 | |
Single Female w/Child | 800 | 6,470 | 11,565 |
Population Change Last Two Decades - Plus Projection
2000 | % | 2010 | % | 2020 | % | 2030 | |
---|---|---|---|---|---|---|---|
California | 33,871,648 | +10 | 37,253,956 | +9 | 40,467,295 | +8 | 43,631,295 |
Alameda County | 1,443,741 | +5 | 1,510,271 | +12 | 1,696,752 | +10 | 1,861,027 |
Contra Costa County | 948,816 | +11 | 1,049,025 | +12 | 1,171,305 | +11 | 1,296,786 |
San Francisco County | 776,733 | +4 | 805,235 | +12 | 903,294 | +8 | 976,481 |
Total Working Age Population:
Total Households:
Total Working Age Population:
Total Households:
Total Working Age Population:
Total Households: