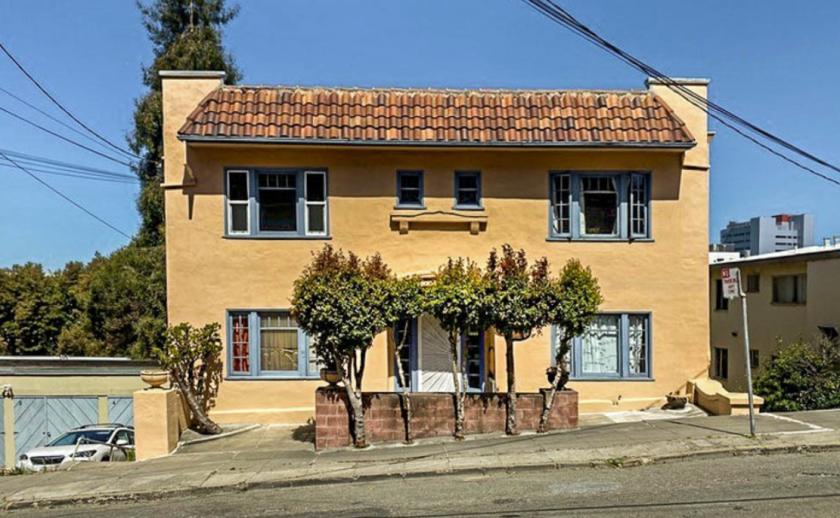
Multifamily Housing
221 Fairmount Avenue Oakland, CA 94611
221 Fairmount Avenue Oakland, CA 94611
Details & Description
Property Highlights
- • Sold off market to a local non-profit
- • Delivered 6-7 units vacant
- • All-cash offer
- • Sought-after Adams Point location
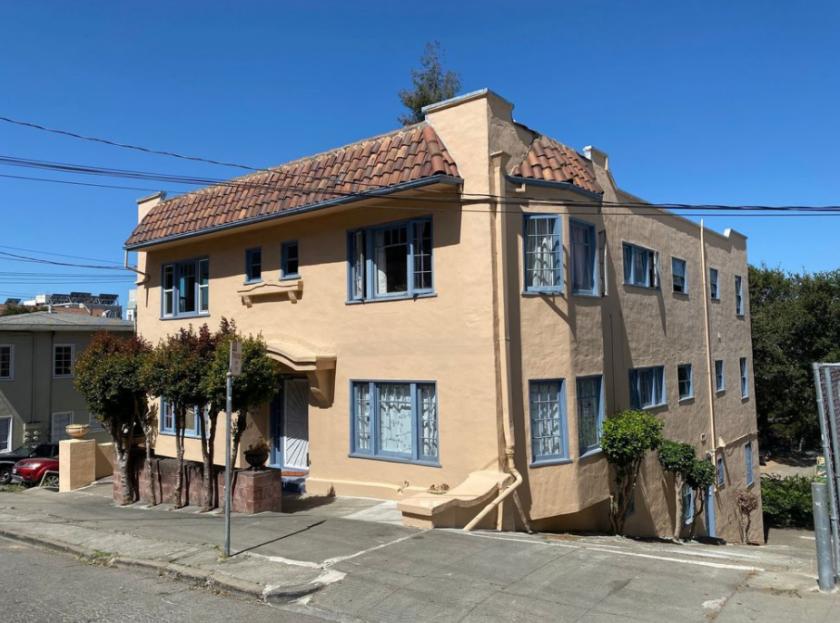
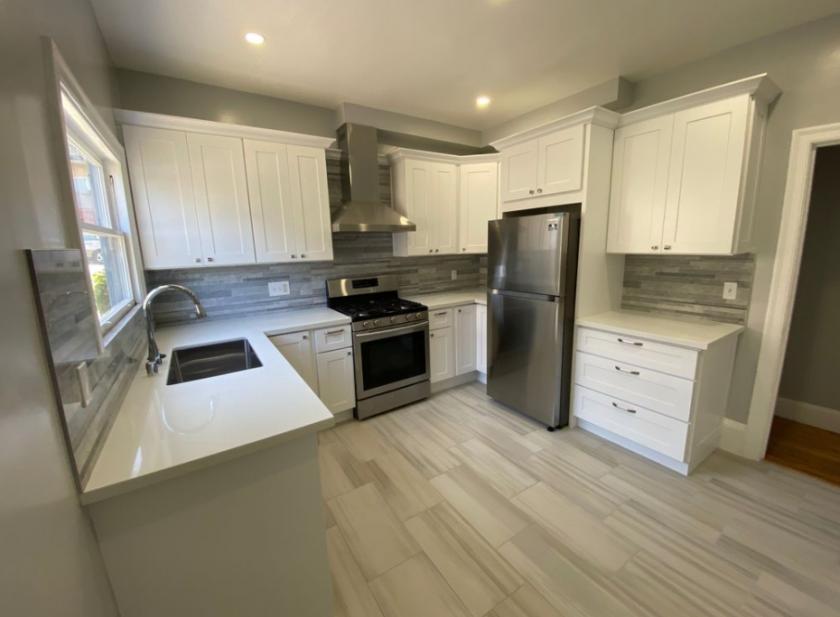
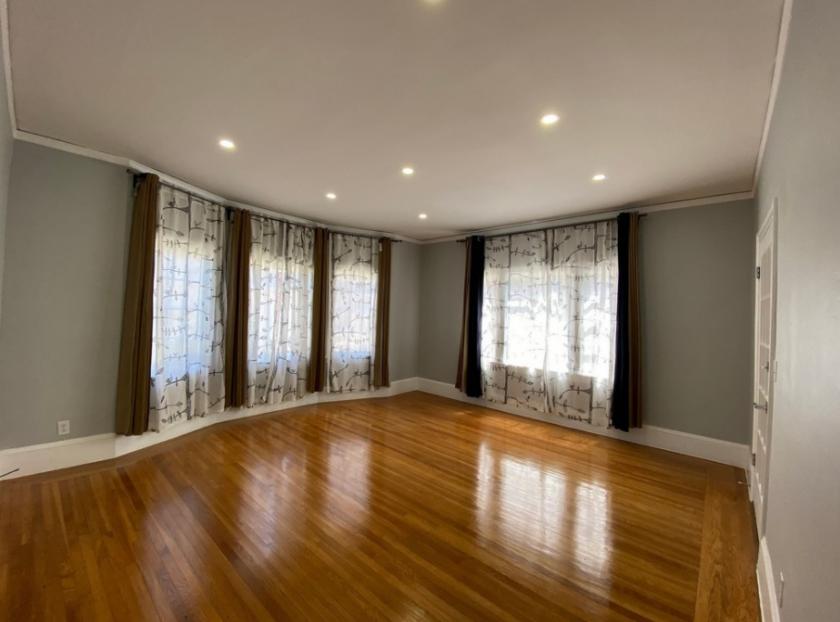
Additional Photos

Listing Agents

Jonathon Burmenko
O: 510-346-5788
M: 925-876-8336
jburmenko@nainorcal.com
O: 510-346-5788
M: 925-876-8336
jburmenko@nainorcal.com

Sam Hayes
O: 415-226-1508
M: 510-759-6844
shayes@nainorcal.com
O: 415-226-1508
M: 510-759-6844
shayes@nainorcal.com

Robert Chappell
NAI NorCal
O: 916-712-3990
M: 916-712-3990
rchappell@nainorcal.com
NAI NorCal
O: 916-712-3990
M: 916-712-3990
rchappell@nainorcal.com
While we strive to provide the most accurate information, all listing information, and demographic data, is provided by third-parties. As such, MyEListing will not be responsible for the accuracy of the information. It is strongly recommended that you verify all information with the listing agent, and any relevant agencies, prior to making any decisions.


