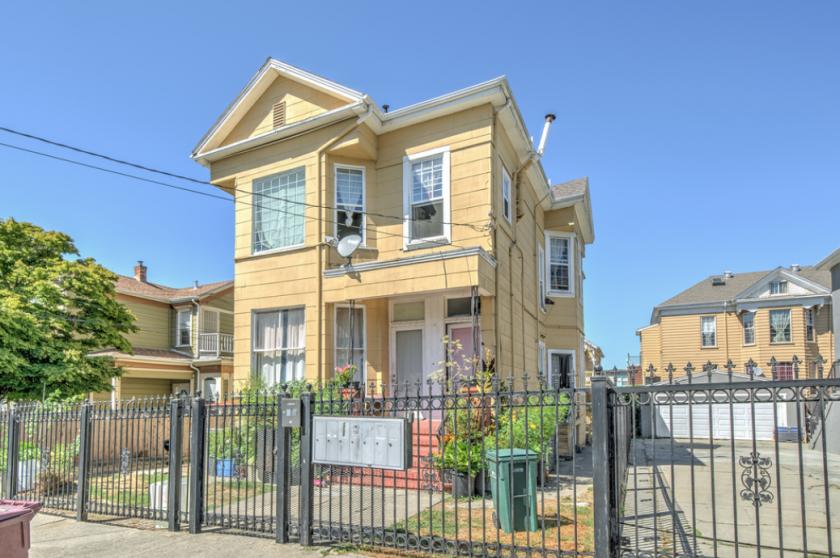
Multifamily Housing
1739 10th Avenue Oakland, CA 94606
1739 10th Avenue Oakland, CA 94606
Details & Description
Property Highlights
- • Individually metered for gas and electric
- • Located near Lake Merritt
- • Over 45 upside in rent
- • Close proximity to shops and restaurants
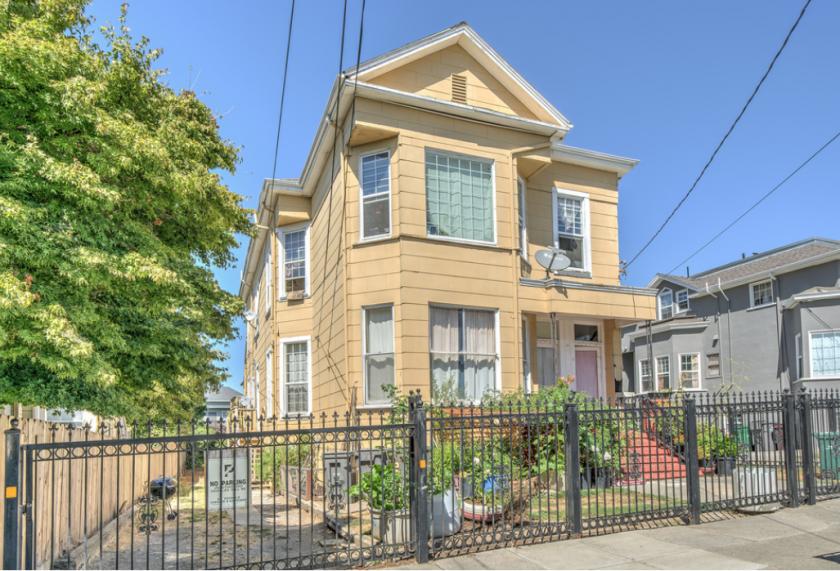
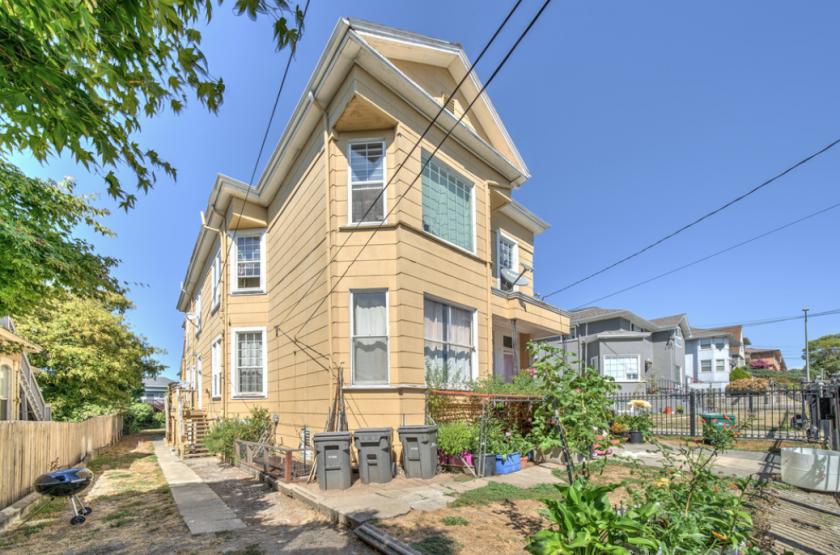
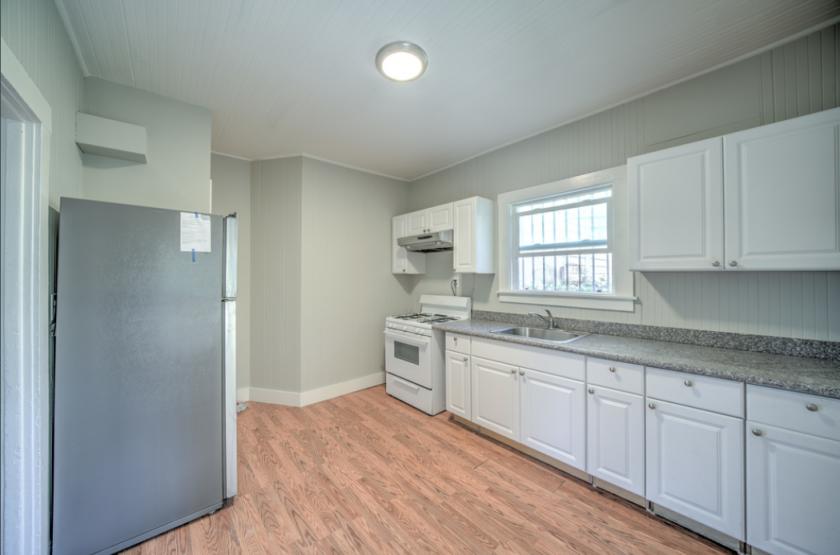
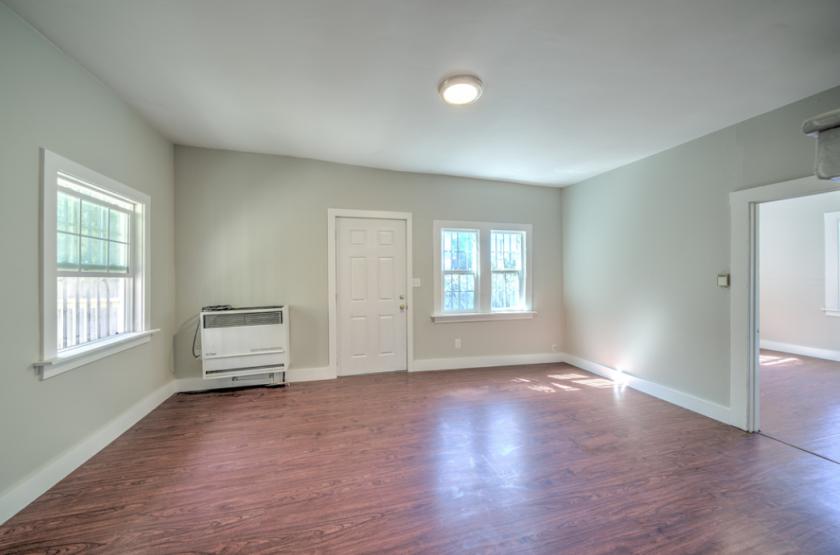
Additional Photos
Listing Agents

Grant Chappell
O: 510-336-4721
M: 415-246-4314
grant@nainorcal.com
O: 510-336-4721
M: 415-246-4314
grant@nainorcal.com
While we strive to provide the most accurate information, all listing information, and demographic data, is provided by third-parties. As such, MyEListing will not be responsible for the accuracy of the information. It is strongly recommended that you verify all information with the listing agent, and any relevant agencies, prior to making any decisions.


