Multifamily Housing
334 Portland Avenue Oakland, CA 94606
334 Portland Avenue Oakland, CA 94606

Details & Description
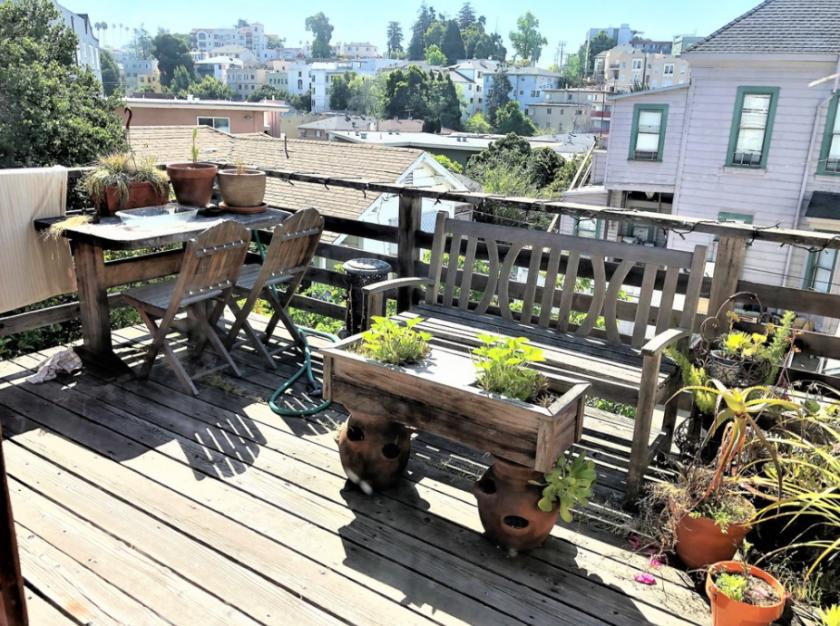
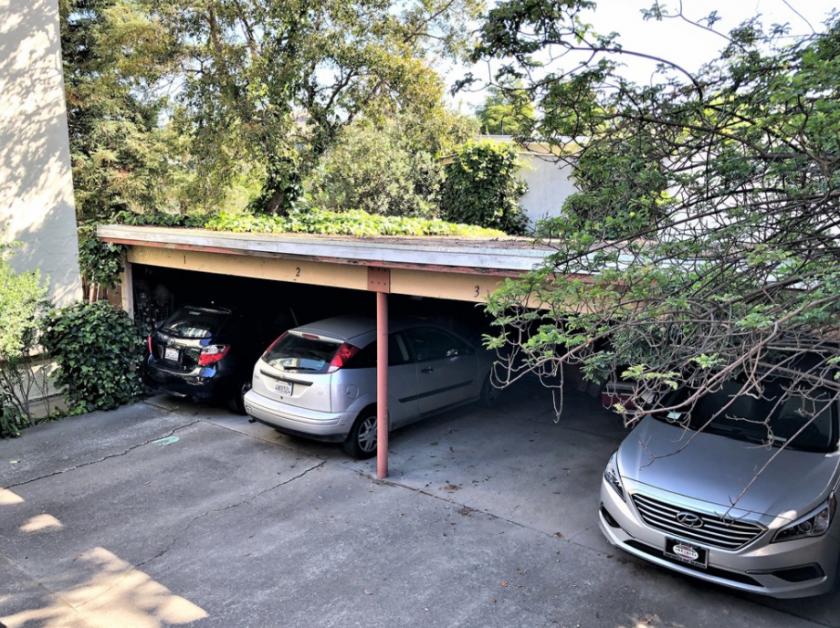
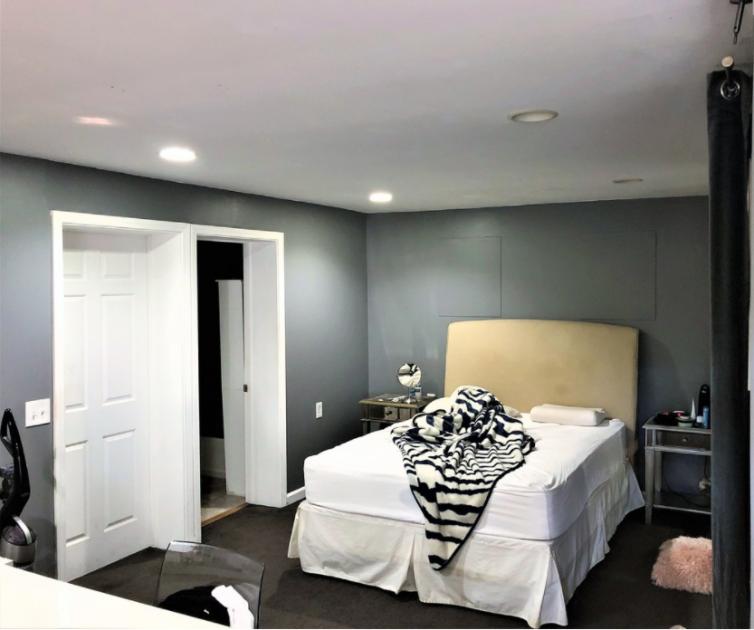
Additional Photos
Listing Agents

Grant Chappell
O: 510-336-4721
M: 415-246-4314
grant@nainorcal.com
O: 510-336-4721
M: 415-246-4314
grant@nainorcal.com
While we strive to provide the most accurate information, all listing information, and demographic data, is provided by third-parties. As such, MyEListing will not be responsible for the accuracy of the information. It is strongly recommended that you verify all information with the listing agent, and any relevant agencies, prior to making any decisions.


