Commercial Land
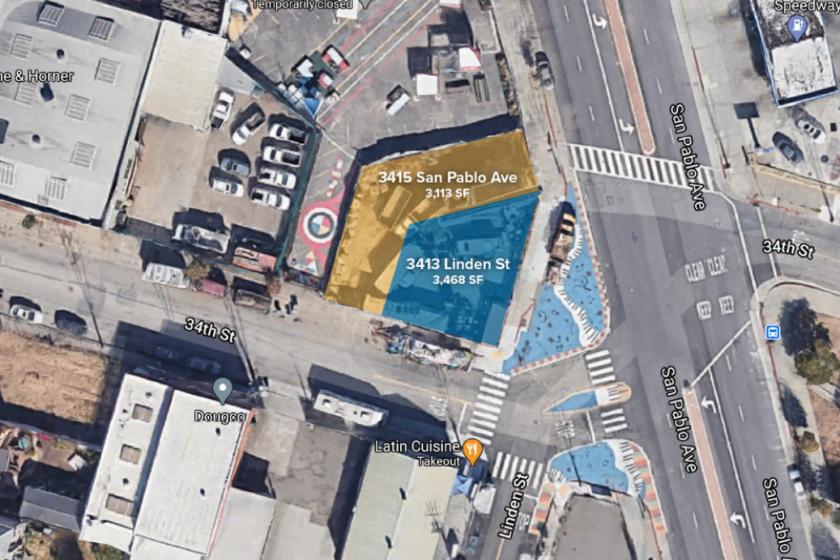
3415 San Pablo Ave and 3413 Linden Street Oakland, CA 94608
3415 San Pablo Ave and 3413 Linden Street Oakland, CA 94608
Details & Description
Property Highlights
• Buyer to verify with city of Oakland the extent of development possibility for the subject property
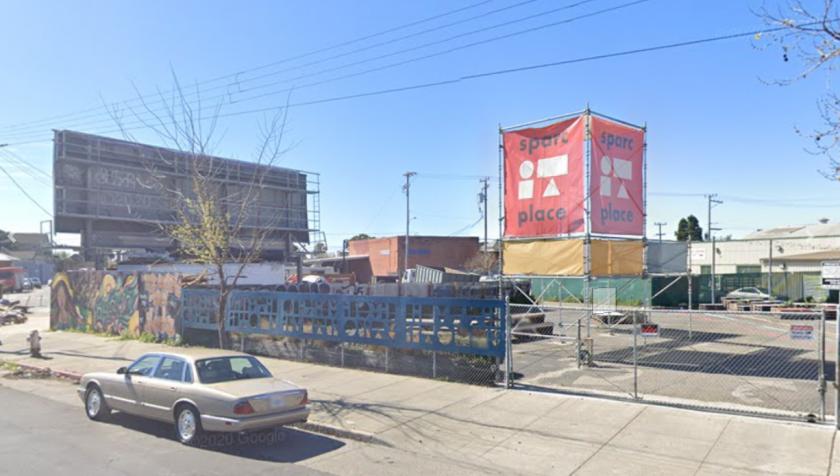
• Unique opportunity to develop two adjacent vacant lots in a prime commuter central location
Listing Agents

Grant Chappell
O: 510-336-4721
M: 415-246-4314
grant@nainorcal.com
O: 510-336-4721
M: 415-246-4314
grant@nainorcal.com

Sam Hayes
O: 415-226-1508
M: 510-759-6844
shayes@nainorcal.com
O: 415-226-1508
M: 510-759-6844
shayes@nainorcal.com

Jonathon Burmenko
O: 510-346-5788
M: 925-876-8336
jburmenko@nainorcal.com
O: 510-346-5788
M: 925-876-8336
jburmenko@nainorcal.com
While we strive to provide the most accurate information, all listing information, and demographic data, is provided by third-parties. As such, MyEListing will not be responsible for the accuracy of the information. It is strongly recommended that you verify all information with the listing agent, and any relevant agencies, prior to making any decisions.