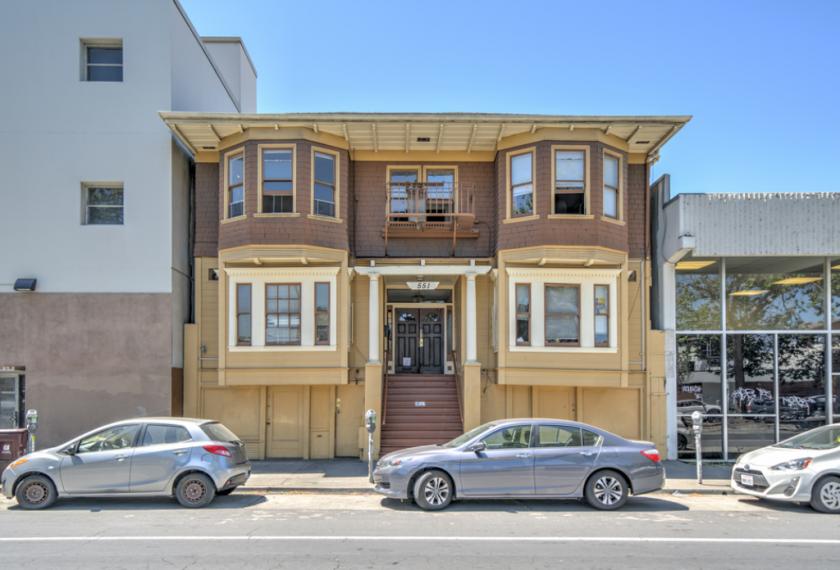
Multifamily Housing
549 West Grand Avenue Oakland, CA 94612
549 West Grand Avenue Oakland, CA 94612
Details & Description
Property Highlights
- • Highly sought-after Uptown location
- • Designated opportunity zone
- • Easy direct access to I-980580 and Highway 24
- • Clean, well-maintained property
- • Value-add potential
- • 3 blocks from the 19th Street BART station
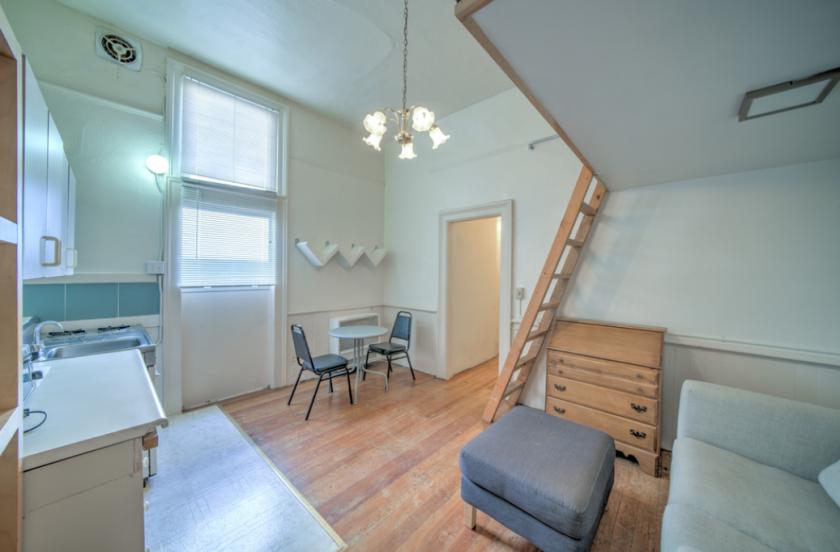
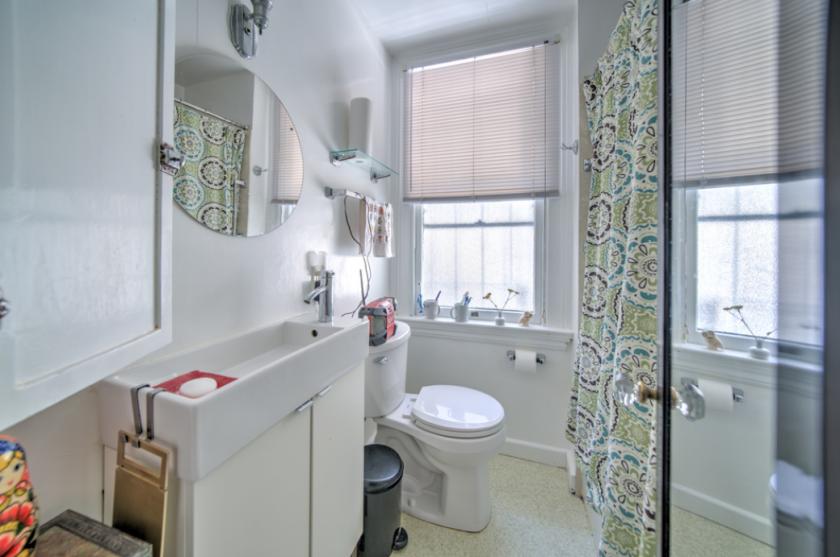
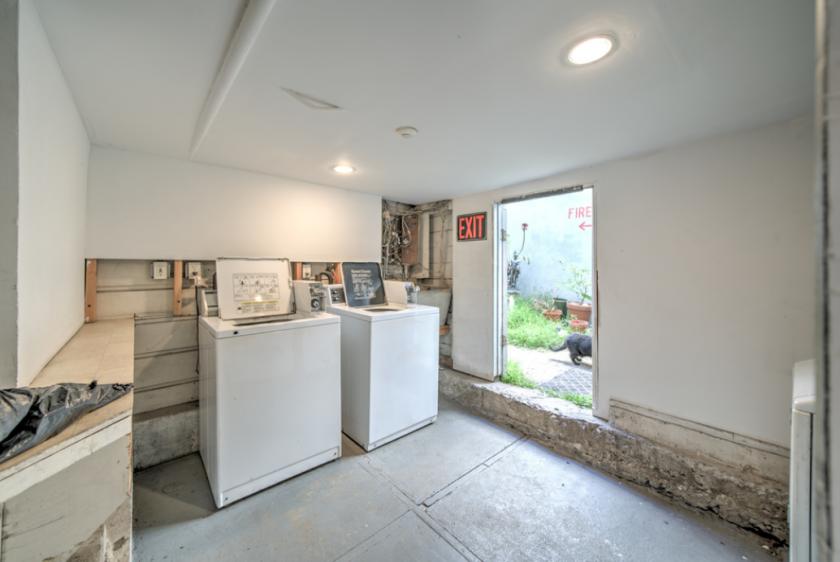
Additional Photos

Listing Agents

Ethan Berger
O: 510-972-4952
M: 925-588-9740
ethan@nainorcal.com
O: 510-972-4952
M: 925-588-9740
ethan@nainorcal.com

Garrett Blair
O: 510-817-2207
M: 949-300-5610
gblair@nainorcal.com
O: 510-817-2207
M: 949-300-5610
gblair@nainorcal.com
While we strive to provide the most accurate information, all listing information, and demographic data, is provided by third-parties. As such, MyEListing will not be responsible for the accuracy of the information. It is strongly recommended that you verify all information with the listing agent, and any relevant agencies, prior to making any decisions.


