Multifamily Housing
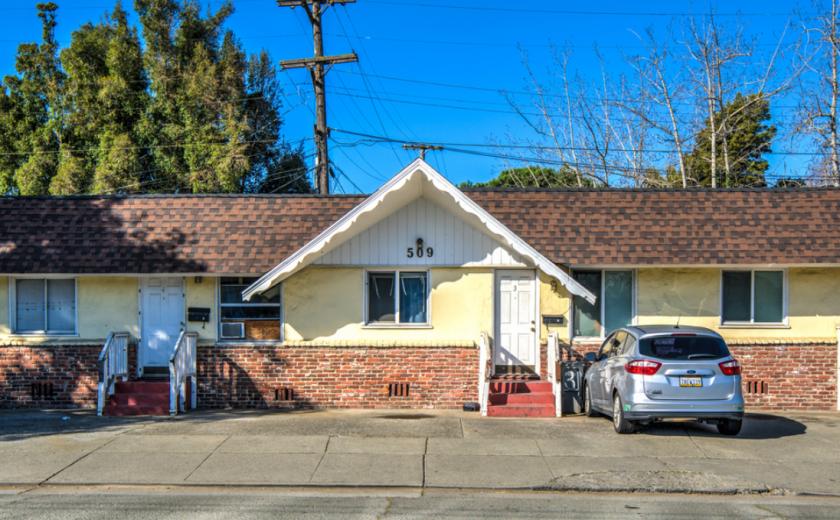
509 Lincoln Road West Vallejo, CA 94590
509 Lincoln Road West Vallejo, CA 94590

Details & Description
Property Highlights
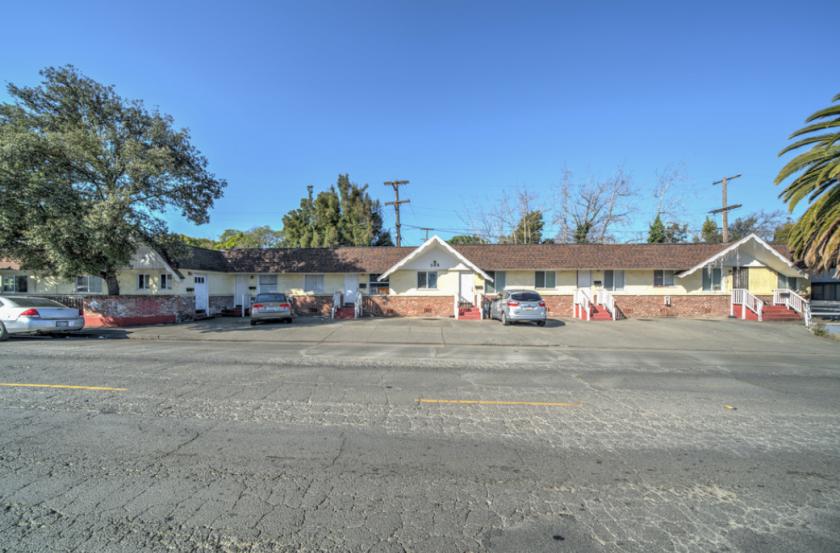
- • 11-Unit building
- • Individually metered PGE
- • Strong cap rate return realized on Day 1
- • 11 on-site parking spaces
- • Low price per door
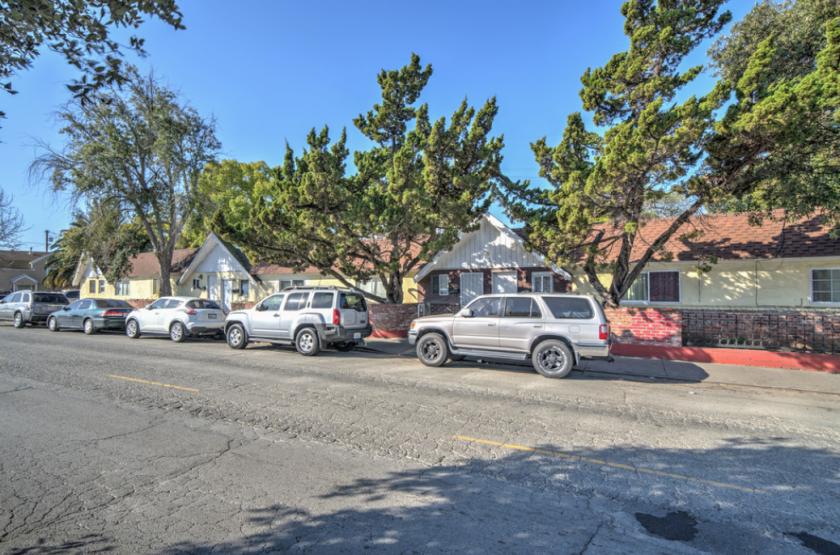
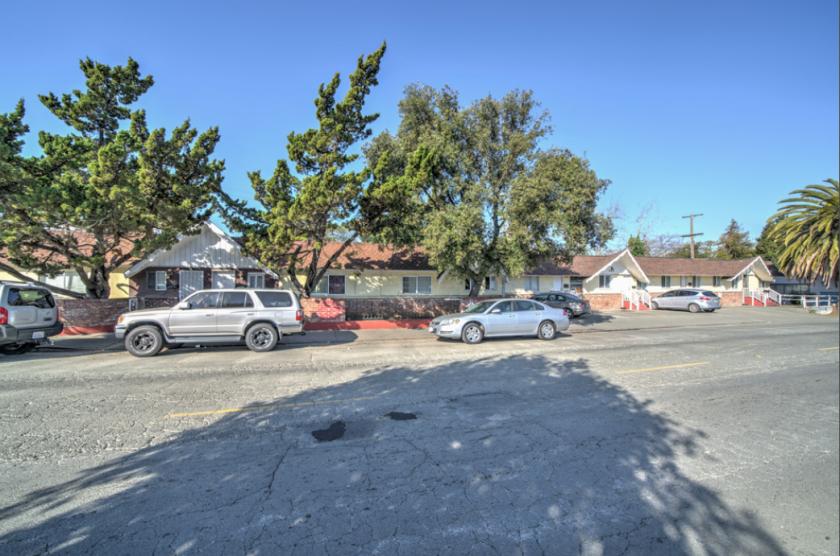
Additional Photos
Listing Agents

Ethan Berger
O: 510-972-4952
M: 925-588-9740
ethan@nainorcal.com
O: 510-972-4952
M: 925-588-9740
ethan@nainorcal.com

Garrett Blair
O: 510-817-2207
M: 949-300-5610
gblair@nainorcal.com
O: 510-817-2207
M: 949-300-5610
gblair@nainorcal.com
While we strive to provide the most accurate information, all listing information, and demographic data, is provided by third-parties. As such, MyEListing will not be responsible for the accuracy of the information. It is strongly recommended that you verify all information with the listing agent, and any relevant agencies, prior to making any decisions.


