Office Space
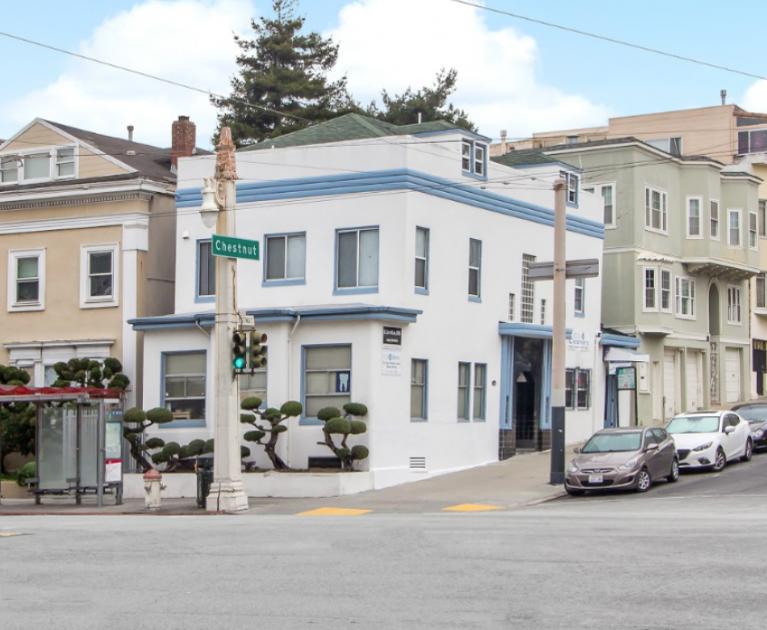
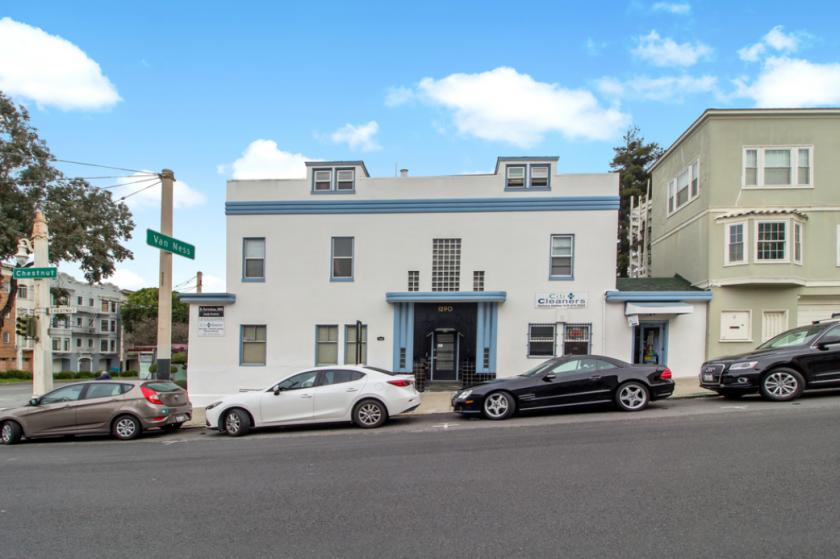
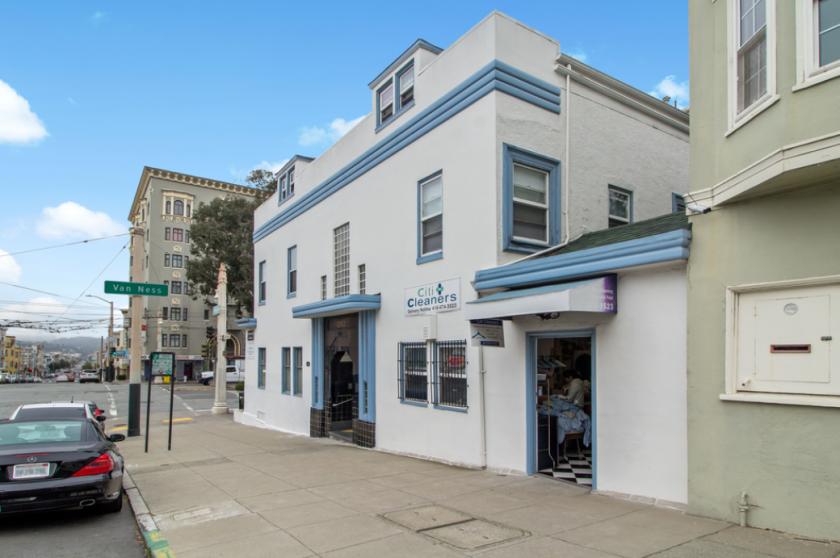
1290 Chestnut Street San Francisco, CA 94109
1290 Chestnut Street San Francisco, CA 94109
Details & Description
Property Highlights
- • 100 Occupied
- • Prime San Francisco location
- • Commercial tenants medical, dry cleanerslaundry
- • Turn-key investment opportunity
- • Units 3 4 fully renovated in 20192020
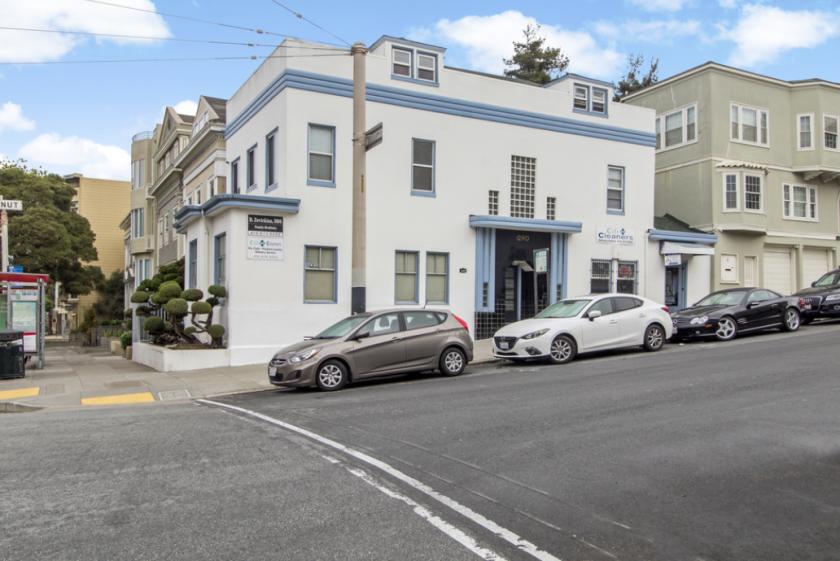
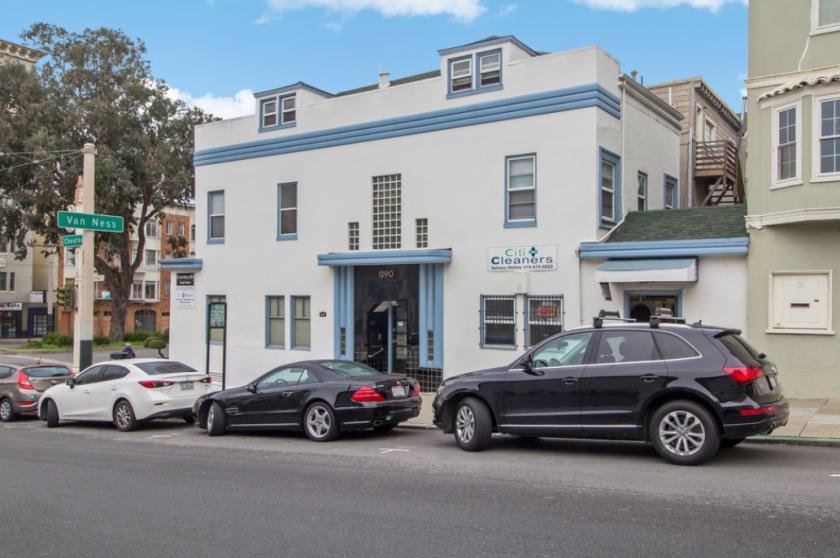
Additional Photos
Listing Agents

Ethan Berger
O: 510-972-4952
M: 925-588-9740
ethan@nainorcal.com
O: 510-972-4952
M: 925-588-9740
ethan@nainorcal.com
While we strive to provide the most accurate information, all listing information, and demographic data, is provided by third-parties. As such, MyEListing will not be responsible for the accuracy of the information. It is strongly recommended that you verify all information with the listing agent, and any relevant agencies, prior to making any decisions.


