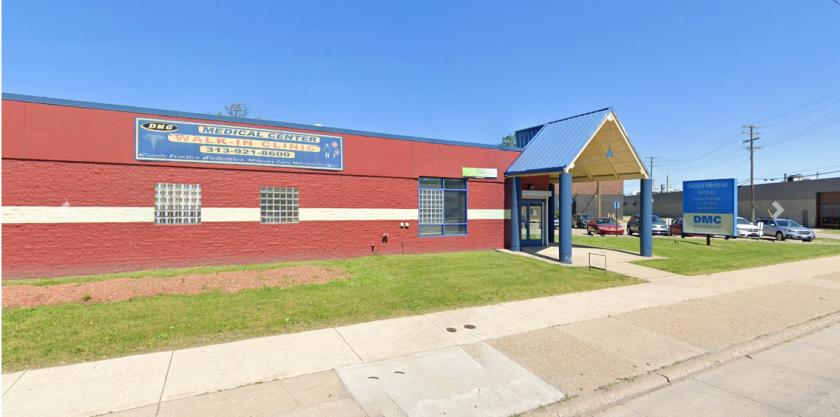
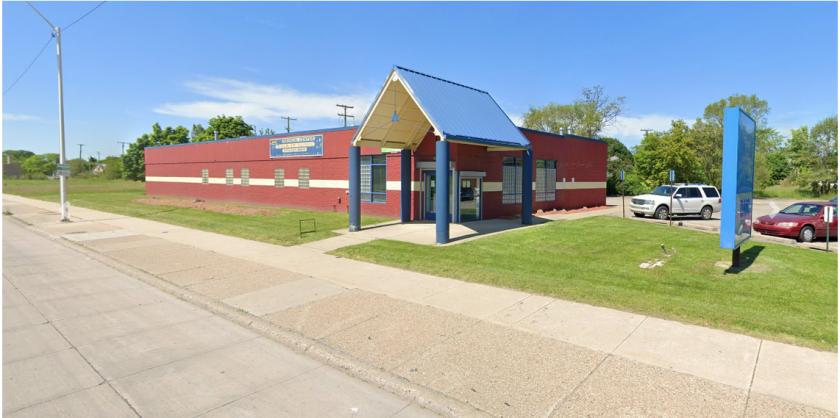
1-Mile | 3-Miles | 5-Miles | ||
---|---|---|---|---|
Total Population | 8,010 | 111,843 | 262,301 | |
Population Median Age | 44 | 39 | 38 | |
Population by Age | 0-9 Yrs | 741 (9%) | 11851 (10%) | 31453 (11%) |
10-19 Yrs | 658 (8%) | 11340 (10%) | 31069 (11%) | |
20-29 Yrs | 1067 (13%) | 22872 (20%) | 48093 (18%) | |
30-39 Yrs | 731 (9%) | 14916 (13%) | 34160 (13%) | |
40-49 Yrs | 1077 (13%) | 11188 (10%) | 28900 (11%) | |
50-59 Yrs | 1454 (18%) | 13351 (11%) | 33159 (12%) | |
60-69 Yrs | 1175 (14%) | 15198 (13%) | 32029 (12%) | |
70+ Yrs | 1107 (13%) | 11128 (9%) | 23438 (8%) | |
Median HH Income | $26,469 | $28,995 | $29,806 | |
Total Household Income | < 24K | 1477 (47%) | 23830 (44%) | 48568 (43%) |
25-49K | 938 (29%) | 12596 (23%) | 28062 (25%) | |
50-74K | 329 (10%) | 6512 (12%) | 14106 (12%) | |
75-99K | 168 (5%) | 4298 (8%) | 8463 (7%) | |
100-199K | 200 (6%) | 4717 (8%) | 9316 (8%) | |
200K+ | 27 (0%) | 1181 (2%) | 2796 (2%) | |
Highest Education Level | No Diploma | 1295 | 13850 | 32668 |
Diploma or GED | 2349 | 20129 | 52673 | |
Some College | 1526 | 17697 | 41582 | |
Assoc. Degree | 372 | 4619 | 11325 | |
Bachelors Degree | 400 | 12349 | 22180 | |
Higher Degree | 210 | 9923 | 17322 | |
Total Housing Units | 5,351 | 70,283 | 157,807 | |
--Owner-Occupied | 1,439 | 14,973 | 42,397 | |
--Renter-Occupied | 1,700 | 38,161 | 68,913 | |
Owner-Occupied Values | < 100K | 1126 | 9739 | 29453 |
100-199K | 148 | 2150 | 5626 | |
200-299K | 54 | 1358 | 3182 | |
300-399K | 33 | 930 | 1911 | |
400-499K | 5 | 263 | 769 | |
500K+ | 74 | 532 | 1456 | |
Total Working Age Population | 6,935 | 94,294 | 213,485 | |
In Work Force | 3,020 | 48,432 | 112,998 | |
Not In Work Force | 3,915 | 45,862 | 100,486 | |
Workforce Employed | 2,648 | 43,529 | 97,510 | |
Workforce Unemployed | 372 | 4,882 | 15,395 | |
Civlian Workforce | 3,020 | 48,411 | 112,905 | |
Military Workforce | 0 | 21 | 94 | |
Total Households | 3,139 | 53,134 | 111,311 | |
Family Households | 1,427 | 18,186 | 48,851 | |
Non-Family Households | 1,712 | 34,948 | 62,459 | |
Married Couple | 456 | 7,946 | 20,272 | |
Other Family | 971 | 10,239 | 28,580 | |
Married w/Child | 60 | 2,557 | 7,133 | |
Single Male w/Child | 47 | 573 | 2,119 | |
Single Female w/Child | 276 | 4,149 | 11,806 |
Population Change Last Two Decades - Plus Projection
2000 | % | 2010 | % | 2020 | % | 2030 | |
---|---|---|---|---|---|---|---|
Michigan | 9,938,444 | -1 | 9,883,640 | +1 | 10,023,423 | +4 | 10,424,510 |
Wayne County | 2,061,162 | -12 | 1,820,584 | -4 | 1,741,463 | -1 | 1,730,000 |
Total Working Age Population:
Total Households:
Total Working Age Population:
Total Households:
Total Working Age Population:
Total Households: