Commercial Land
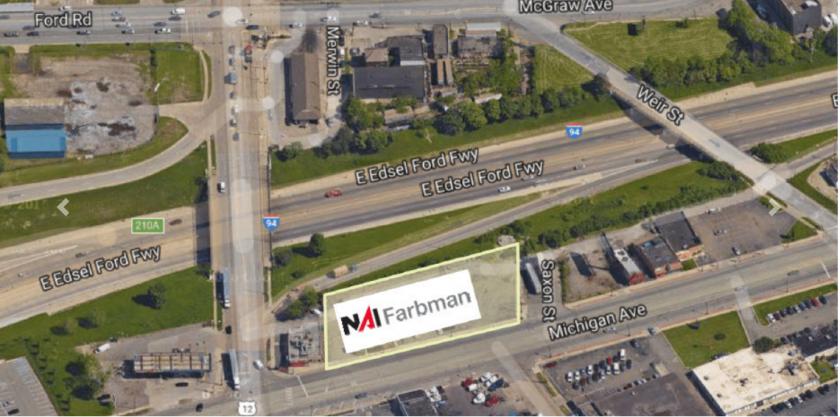
9430 Michigan Avenue Detroit, MI 48210
9430 Michigan Avenue Detroit, MI 48210
Details & Description
Property Highlights
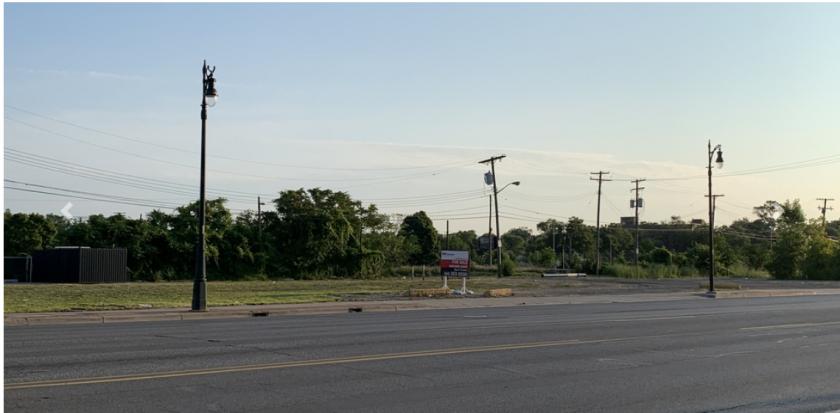
- • Vacant Land For SaleGround Lease NNN
- • Michigan Ave Frontage
- • Strong Demographics High Traffic
- • Title Work Ready For Close
- • All Utilities, multiple curb cuts
- • Highly Visible
Listing Agents

Nanci Tarpley
O: 248-351-6323
M: 734-552-5543
tarpley@farbman.com
O: 248-351-6323
M: 734-552-5543
tarpley@farbman.com
While we strive to provide the most accurate information, all listing information, and demographic data, is provided by third-parties. As such, MyEListing will not be responsible for the accuracy of the information. It is strongly recommended that you verify all information with the listing agent, and any relevant agencies, prior to making any decisions.