Commercial Land
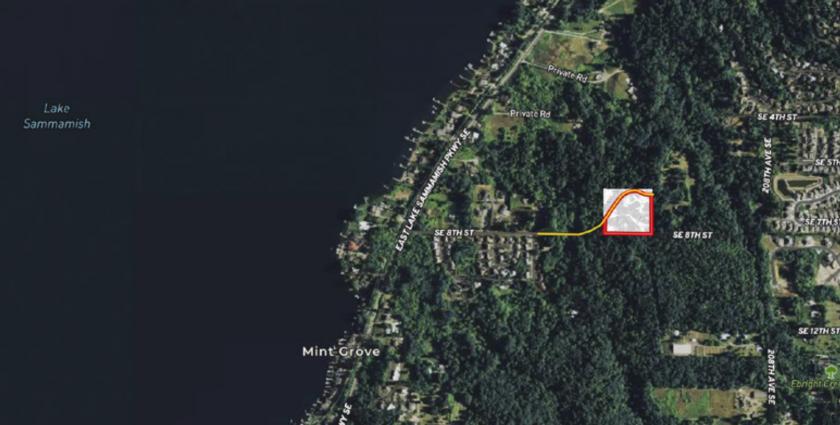
SE 8th St. Sammamish, WA 98075
SE 8th St. Sammamish, WA 98075
Details & Description
Property Highlights
- • New Price
- • Owner Financing is Now Available
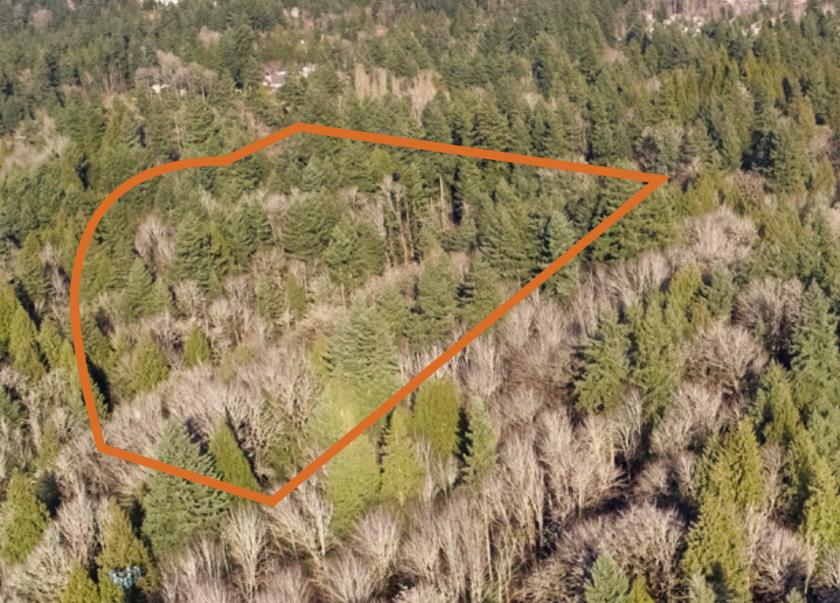
- • Tranquil Sammamish property spanning 4.65 acres
- • Private site to build one home in Sammamish
- • Approved Reasonable Use Exception
- • Due Diligence information Available
Listing Agents

Mathis Jessen
M: 206-963-6896
mjessen@landadvisors.com
M: 206-963-6896
mjessen@landadvisors.com
While we strive to provide the most accurate information, all listing information, and demographic data, is provided by third-parties. As such, MyEListing will not be responsible for the accuracy of the information. It is strongly recommended that you verify all information with the listing agent, and any relevant agencies, prior to making any decisions.