Industrial Properties
20000 Park Row Katy, TX 77449
20000 Park Row Katy, TX 77449

Details & Description
Property Highlights
- • Easy Access to I-10 and Grand Parkway
- • Clear Height 24
- • 4 Automatic Overhead Doors 12x12
- • 61 Parking Spaces
- • Security Cameras
- • Monument Signage
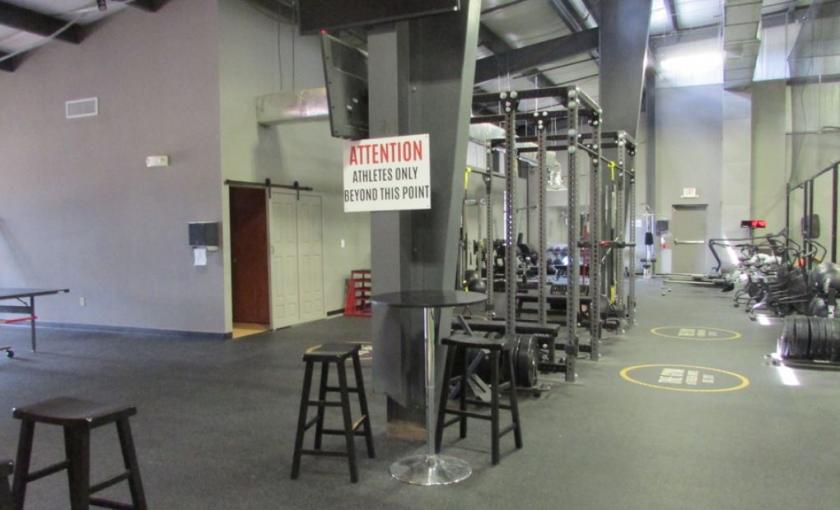
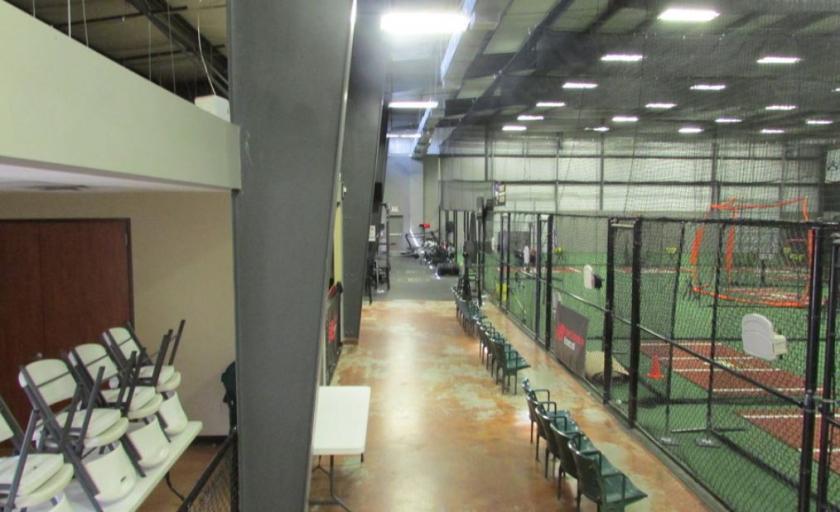
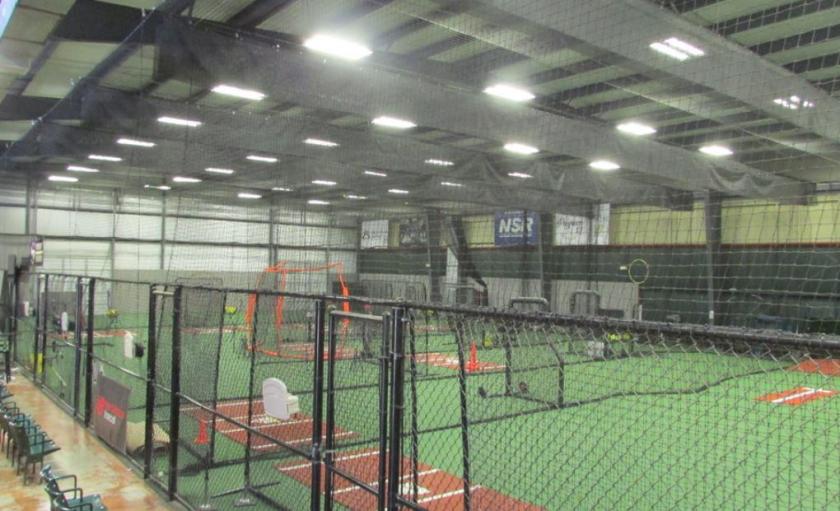
Additional Photos

Listing Agents

Liz Westcott-Brown
O: 713-985-4632
M: 832-671-8288
liz.westcott-brown@partnersrealestate.com
O: 713-985-4632
M: 832-671-8288
liz.westcott-brown@partnersrealestate.com

Randy Wilhelm
O: 713-985-4626
randy.wilhelm@partnersrealestate.com
O: 713-985-4626
randy.wilhelm@partnersrealestate.com
While we strive to provide the most accurate information, all listing information, and demographic data, is provided by third-parties. As such, MyEListing will not be responsible for the accuracy of the information. It is strongly recommended that you verify all information with the listing agent, and any relevant agencies, prior to making any decisions.


