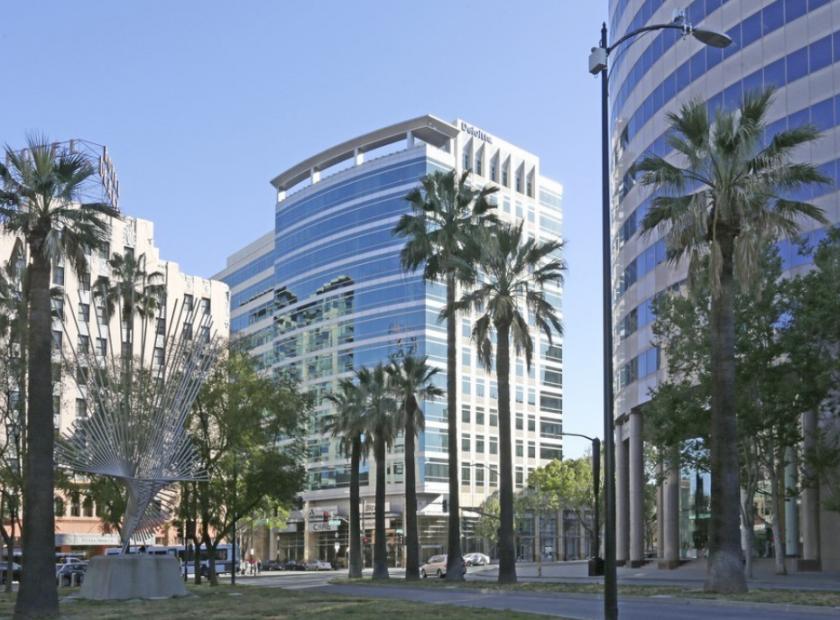
Office Space
225 West Santa Clara Street San Jose, CA 95113
225 West Santa Clara Street San Jose, CA 95113
Details & Description
Property Highlights
- • LED 11302024
- • On-site parking and security
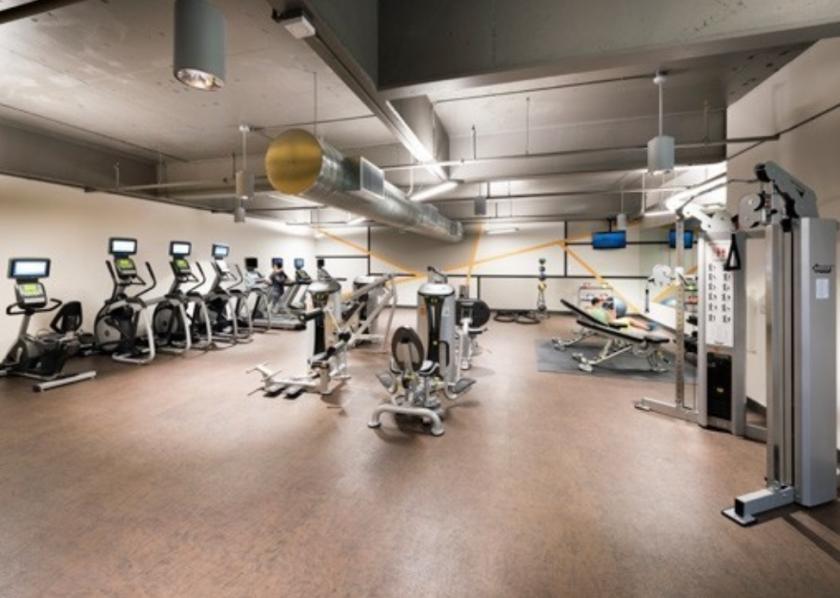
- • Proximity to a variety of local amenities
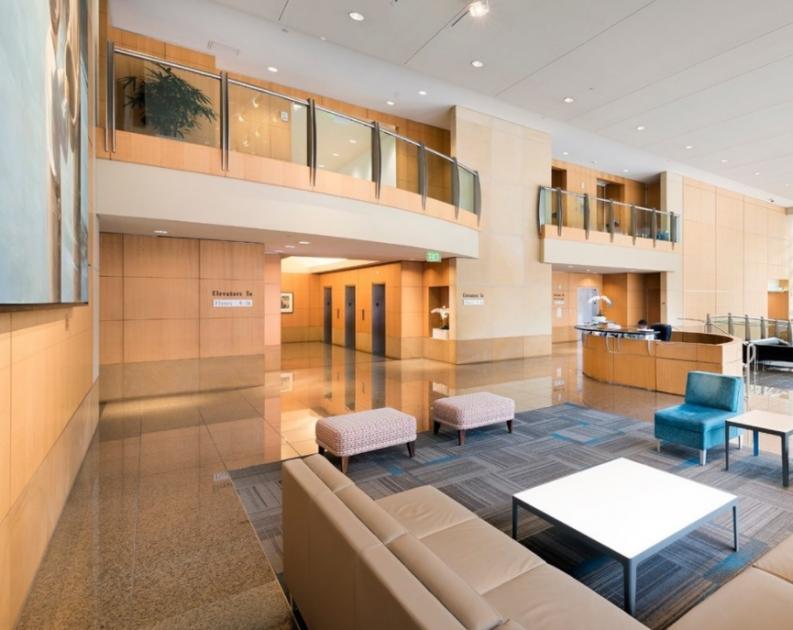
- • Full build-out
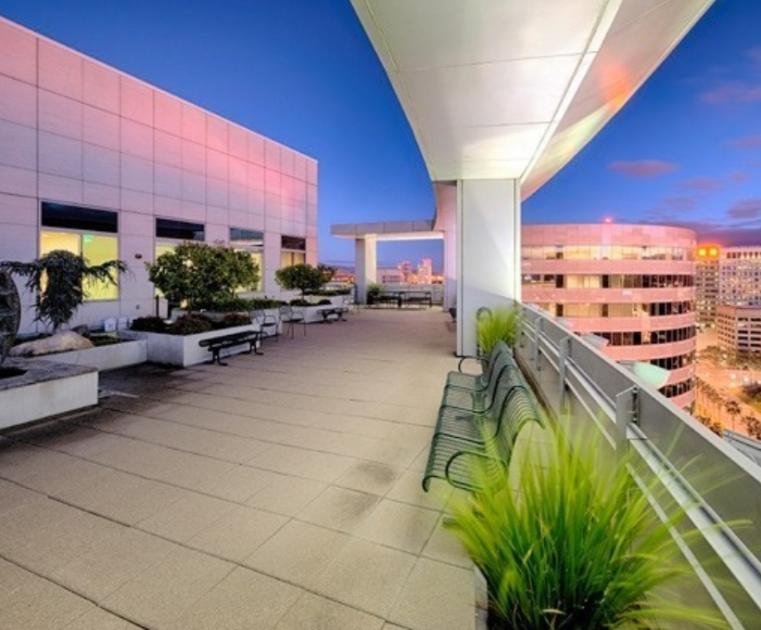
- • Central downtown location
Additional Photos

Listing Agents

Douglas Sharpe
O: 408-740-7224
M: 408-482-8959
dsharpe@nainorcal.com
O: 408-740-7224
M: 408-482-8959
dsharpe@nainorcal.com
While we strive to provide the most accurate information, all listing information, and demographic data, is provided by third-parties. As such, MyEListing will not be responsible for the accuracy of the information. It is strongly recommended that you verify all information with the listing agent, and any relevant agencies, prior to making any decisions.


