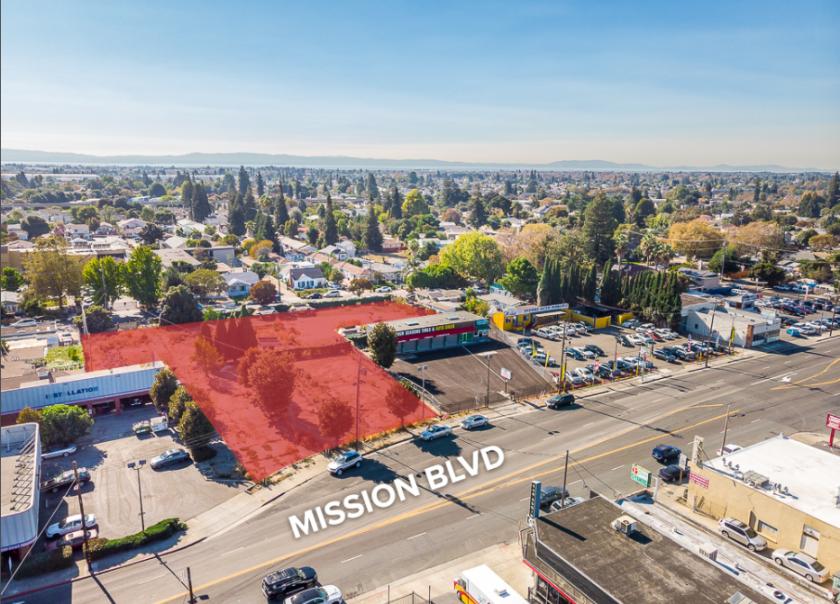
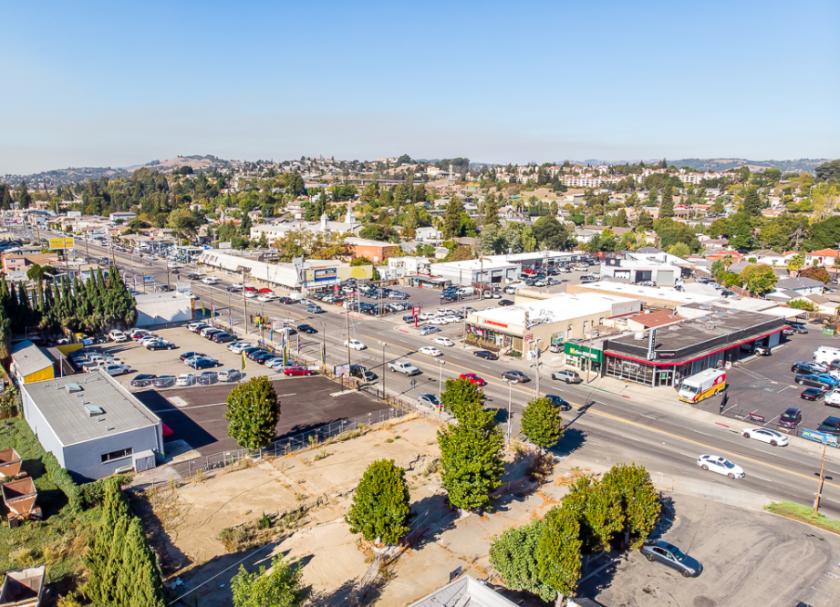
1-Mile | 3-Miles | 5-Miles | ||
---|---|---|---|---|
Total Population | 31,935 | 227,803 | 360,924 | |
Population Median Age | 37 | 38 | 39 | |
Population by Age | 0-9 Yrs | 3856 (12%) | 28681 (12%) | 42542 (11%) |
10-19 Yrs | 3435 (10%) | 25809 (11%) | 40819 (11%) | |
20-29 Yrs | 4838 (15%) | 33034 (14%) | 51454 (14%) | |
30-39 Yrs | 5840 (18%) | 37971 (16%) | 56428 (15%) | |
40-49 Yrs | 4203 (13%) | 30164 (13%) | 47841 (13%) | |
50-59 Yrs | 4296 (13%) | 29541 (12%) | 49481 (13%) | |
60-69 Yrs | 2950 (9%) | 23527 (10%) | 39427 (10%) | |
70+ Yrs | 2516 (7%) | 19076 (8%) | 32932 (9%) | |
Median HH Income | $80,081 | $84,152 | $85,918 | |
Total Household Income | < 24K | 1693 (15%) | 9571 (12%) | 14311 (12%) |
25-49K | 1581 (14%) | 11701 (15%) | 18589 (15%) | |
50-74K | 1862 (16%) | 11799 (15%) | 18588 (15%) | |
75-99K | 1912 (17%) | 11322 (15%) | 16551 (14%) | |
100-199K | 3212 (29%) | 22858 (30%) | 36060 (30%) | |
200K+ | 789 (7%) | 7182 (9%) | 13334 (11%) | |
Highest Education Level | No Diploma | 4047 | 26169 | 41053 |
Diploma or GED | 5950 | 40728 | 64542 | |
Some College | 4560 | 33800 | 52726 | |
Assoc. Degree | 1552 | 11297 | 18857 | |
Bachelors Degree | 4458 | 33280 | 54271 | |
Higher Degree | 1820 | 13518 | 23528 | |
Total Housing Units | 11,684 | 77,578 | 122,465 | |
--Owner-Occupied | 4,031 | 38,508 | 65,621 | |
--Renter-Occupied | 7,017 | 35,925 | 51,811 | |
Owner-Occupied Values | < 100K | 34 | 930 | 2202 |
100-199K | 69 | 640 | 1534 | |
200-299K | 130 | 925 | 2023 | |
300-399K | 421 | 2896 | 4634 | |
400-499K | 914 | 6278 | 9831 | |
500K+ | 2464 | 26839 | 45396 | |
Total Working Age Population | 25,872 | 183,001 | 293,366 | |
In Work Force | 17,222 | 123,026 | 195,340 | |
Not In Work Force | 8,649 | 59,975 | 98,026 | |
Workforce Employed | 16,482 | 117,086 | 185,653 | |
Workforce Unemployed | 740 | 5,844 | 9,489 | |
Civlian Workforce | 17,222 | 122,930 | 195,142 | |
Military Workforce | 0 | 96 | 198 | |
Total Households | 11,048 | 74,433 | 117,432 | |
Family Households | 6,859 | 52,503 | 83,330 | |
Non-Family Households | 4,189 | 21,930 | 34,102 | |
Married Couple | 4,457 | 35,971 | 58,202 | |
Other Family | 2,402 | 16,532 | 25,128 | |
Married w/Child | 2,016 | 16,264 | 25,482 | |
Single Male w/Child | 405 | 2,074 | 2,970 | |
Single Female w/Child | 745 | 5,502 | 7,878 |
Population Change Last Two Decades - Plus Projection
2000 | % | 2010 | % | 2020 | % | 2030 | |
---|---|---|---|---|---|---|---|
California | 33,871,648 | +10 | 37,253,956 | +9 | 40,467,295 | +8 | 43,631,295 |
Alameda County | 1,443,741 | +5 | 1,510,271 | +12 | 1,696,752 | +10 | 1,861,027 |
Contra Costa County | 948,816 | +11 | 1,049,025 | +12 | 1,171,305 | +11 | 1,296,786 |
San Mateo County | 707,161 | +2 | 718,451 | +9 | 785,650 | +6 | 833,868 |
Total Working Age Population:
Total Households:
Total Working Age Population:
Total Households:
Total Working Age Population:
Total Households: