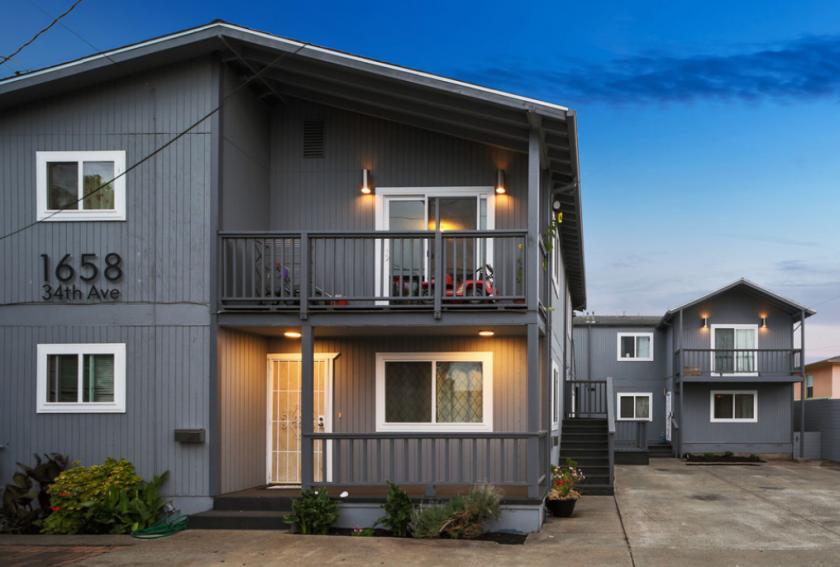
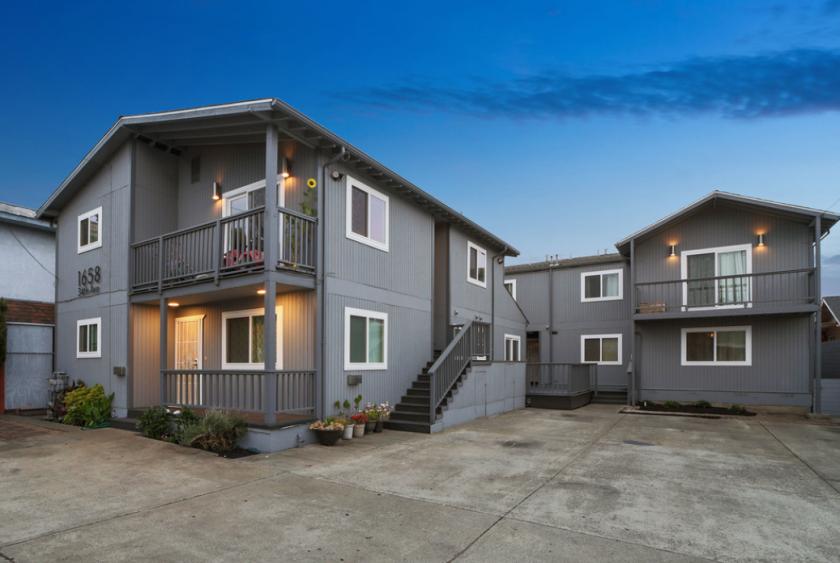
Multifamily Housing
1658 34th Avenue Oakland, CA 94601
1658 34th Avenue Oakland, CA 94601
Details & Description
Property Highlights
- • Close proximity to the I-880 I-80 freeways
- • LARGE Townhome Style Units
- • Ample parking
- • Within walking distance to Fruitvale BART station
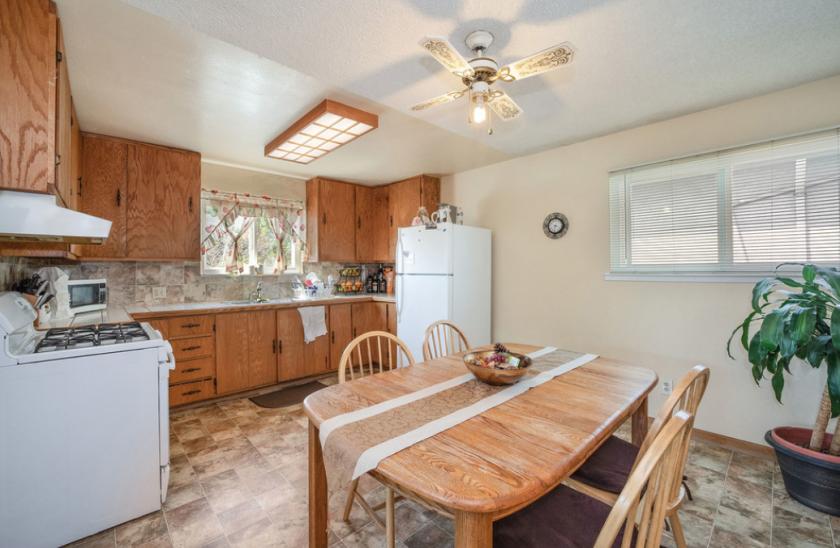
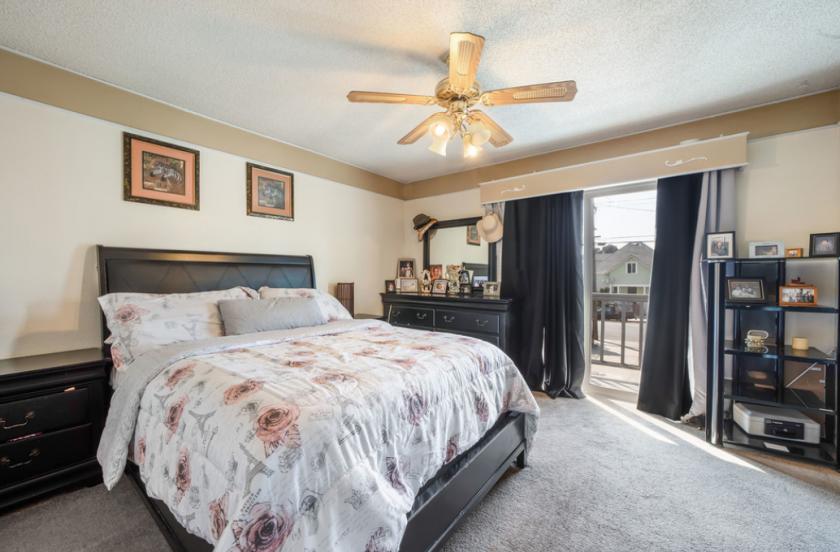
Additional Photos
Listing Agents

Joel Calvillo
O: 408-892-9158
M: 408-892-9158
joel@thecalvillogroup.com
O: 408-892-9158
M: 408-892-9158
joel@thecalvillogroup.com
While we strive to provide the most accurate information, all listing information, and demographic data, is provided by third-parties. As such, MyEListing will not be responsible for the accuracy of the information. It is strongly recommended that you verify all information with the listing agent, and any relevant agencies, prior to making any decisions.


