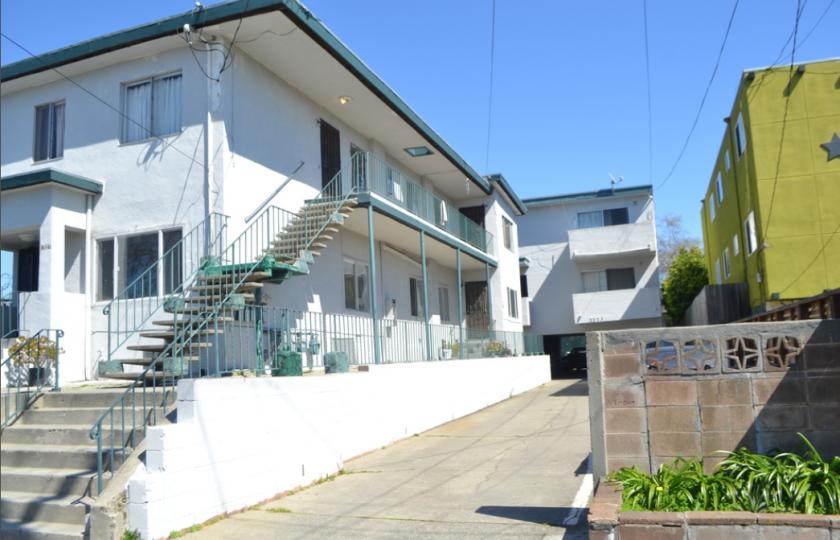
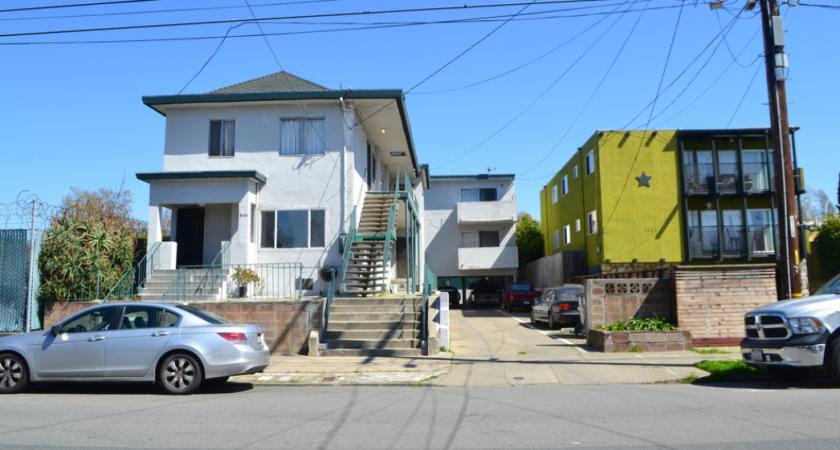
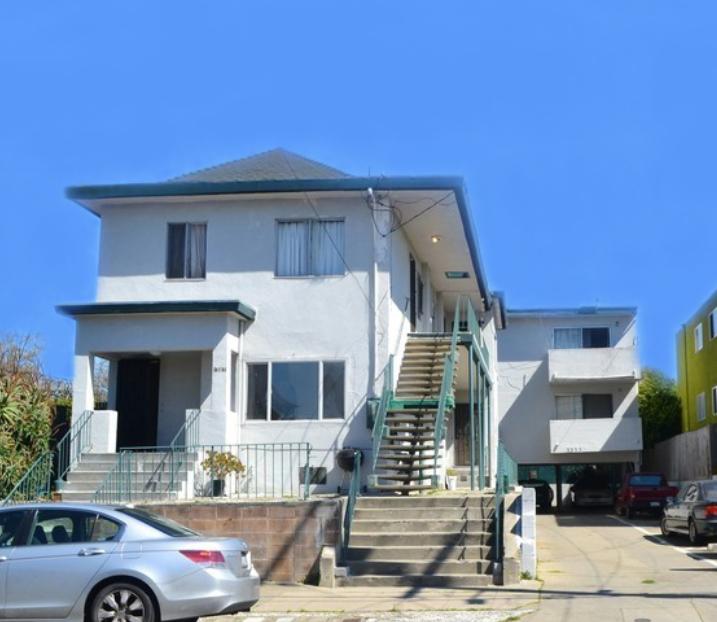
1-Mile | 3-Miles | 5-Miles | ||
---|---|---|---|---|
Total Population | 29,701 | 224,834 | 414,573 | |
Population Median Age | 39 | 38 | 39 | |
Population by Age | 0-9 Yrs | 2767 (9%) | 18642 (8%) | 34878 (8%) |
10-19 Yrs | 2916 (9%) | 25326 (11%) | 40853 (9%) | |
20-29 Yrs | 5652 (19%) | 50075 (22%) | 80329 (19%) | |
30-39 Yrs | 5129 (17%) | 38497 (17%) | 75339 (18%) | |
40-49 Yrs | 4311 (14%) | 27356 (12%) | 52508 (12%) | |
50-59 Yrs | 3116 (10%) | 22751 (10%) | 45668 (11%) | |
60-69 Yrs | 3163 (10%) | 21978 (9%) | 43453 (10%) | |
70+ Yrs | 2648 (8%) | 20209 (8%) | 41544 (10%) | |
Median HH Income | $82,640 | $91,038 | $89,105 | |
Total Household Income | < 24K | 2303 (18%) | 15276 (16%) | 30367 (17%) |
25-49K | 1988 (15%) | 13171 (14%) | 24907 (14%) | |
50-74K | 1697 (13%) | 10932 (11%) | 21230 (12%) | |
75-99K | 1284 (10%) | 10018 (10%) | 19178 (10%) | |
100-199K | 3680 (28%) | 24805 (27%) | 46127 (26%) | |
200K+ | 1809 (14%) | 17412 (19%) | 32844 (18%) | |
Highest Education Level | No Diploma | 1061 | 7170 | 19732 |
Diploma or GED | 1797 | 12779 | 29097 | |
Some College | 3510 | 19025 | 41258 | |
Assoc. Degree | 1190 | 7854 | 16893 | |
Bachelors Degree | 7399 | 53672 | 101036 | |
Higher Degree | 6942 | 55621 | 95432 | |
Total Housing Units | 13,671 | 98,160 | 186,546 | |
--Owner-Occupied | 5,171 | 38,175 | 71,154 | |
--Renter-Occupied | 7,591 | 53,439 | 103,499 | |
Owner-Occupied Values | < 100K | 138 | 679 | 1374 |
100-199K | 66 | 530 | 1076 | |
200-299K | 74 | 1324 | 2147 | |
300-399K | 129 | 2521 | 5034 | |
400-499K | 261 | 2356 | 5424 | |
500K+ | 4503 | 30766 | 56099 | |
Total Working Age Population | 25,152 | 196,204 | 360,549 | |
In Work Force | 17,530 | 131,113 | 244,543 | |
Not In Work Force | 7,622 | 65,091 | 116,006 | |
Workforce Employed | 16,695 | 124,764 | 231,234 | |
Workforce Unemployed | 835 | 6,289 | 13,176 | |
Civlian Workforce | 17,530 | 131,053 | 244,411 | |
Military Workforce | 0 | 60 | 132 | |
Total Households | 12,762 | 91,615 | 174,653 | |
Family Households | 6,229 | 42,914 | 82,923 | |
Non-Family Households | 6,533 | 48,701 | 91,730 | |
Married Couple | 4,237 | 32,147 | 61,420 | |
Other Family | 1,991 | 10,767 | 21,503 | |
Married w/Child | 1,899 | 13,335 | 23,640 | |
Single Male w/Child | 326 | 1,262 | 2,219 | |
Single Female w/Child | 706 | 3,487 | 7,157 |
Population Change Last Two Decades - Plus Projection
2000 | % | 2010 | % | 2020 | % | 2030 | |
---|---|---|---|---|---|---|---|
California | 33,871,648 | +10 | 37,253,956 | +9 | 40,467,295 | +8 | 43,631,295 |
Alameda County | 1,443,741 | +5 | 1,510,271 | +12 | 1,696,752 | +10 | 1,861,027 |
Contra Costa County | 948,816 | +11 | 1,049,025 | +12 | 1,171,305 | +11 | 1,296,786 |
Marin County | 247,289 | +2 | 252,409 | +4 | 263,085 | +2 | 267,912 |
San Francisco County | 776,733 | +4 | 805,235 | +12 | 903,294 | +8 | 976,481 |
Total Working Age Population:
Total Households:
Total Working Age Population:
Total Households:
Total Working Age Population:
Total Households: