Retail Space
2600 West Davison Street Detroit, MI 48238
2600 West Davison Street Detroit, MI 48238
Details & Description
Property Highlights
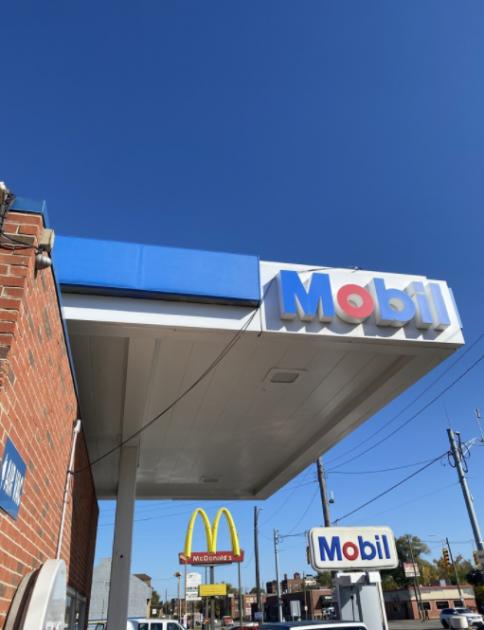
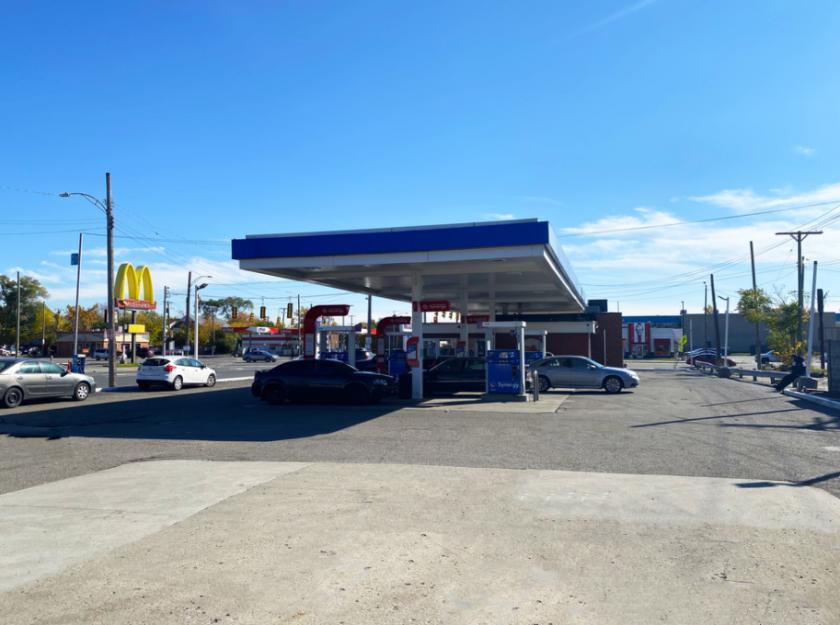
- • 0.5 Acre Hard Corner at Lighted Intersection
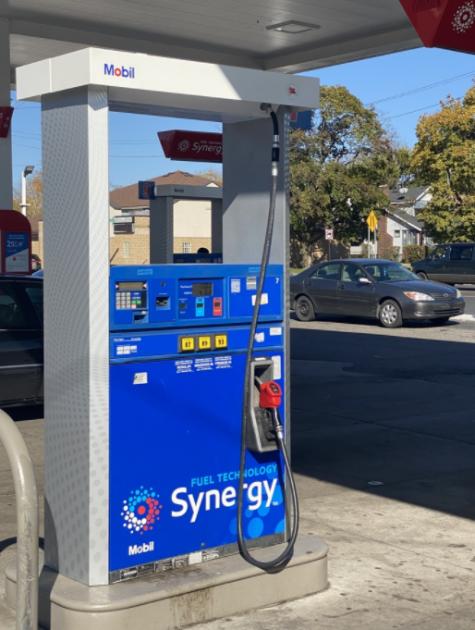
- • 12 Pumps - Replaced within the Last Four Years
- • 37,000 - Cars Daily
- • 1,600 - SF C-Store with Room to Expand
- • Currently No Alcohol Sales
- • Please Do Not Approach Employees
Listing Agents

Paul DeBono
O: 248-470-3015
PaulDebono@BeanstalkRES.com
O: 248-470-3015
PaulDebono@BeanstalkRES.com
While we strive to provide the most accurate information, all listing information, and demographic data, is provided by third-parties. As such, MyEListing will not be responsible for the accuracy of the information. It is strongly recommended that you verify all information with the listing agent, and any relevant agencies, prior to making any decisions.