Industrial Properties
7211 North Loop East Houston, TX 77028
7211 North Loop East Houston, TX 77028

Details & Description
Property Highlights
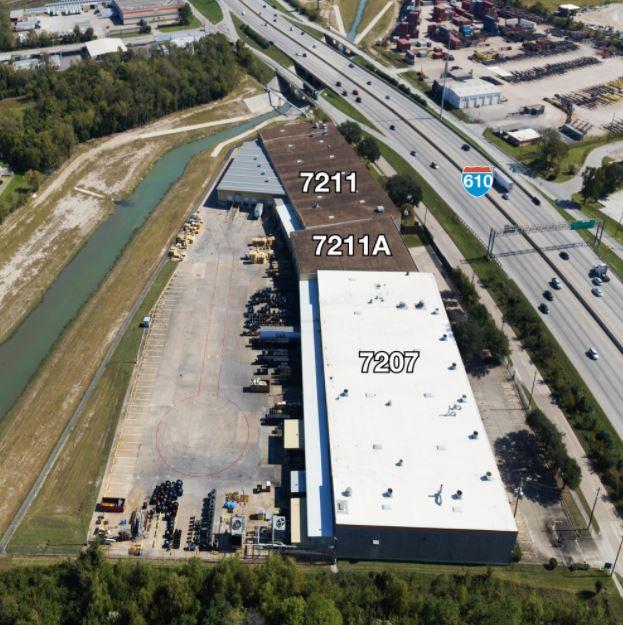
- • 7207 North Loop East
- • 56,650 SF
- • 9,740 SF two-story office
- • Clear height 26
- • 7211A North Loop East
- • 12,040 SF
Listing Agents

Holden Rushing
O: 713-275-9612
holden.rushing@partnersrealestate.com
O: 713-275-9612
holden.rushing@partnersrealestate.com

Chris Haro
O: 713-275-9620
chris.haro@naipartners.com
O: 713-275-9620
chris.haro@naipartners.com

John Simons
O: 713-275-9634
john.simons@partnersrealestate.com
O: 713-275-9634
john.simons@partnersrealestate.com
While we strive to provide the most accurate information, all listing information, and demographic data, is provided by third-parties. As such, MyEListing will not be responsible for the accuracy of the information. It is strongly recommended that you verify all information with the listing agent, and any relevant agencies, prior to making any decisions.