Commercial Land
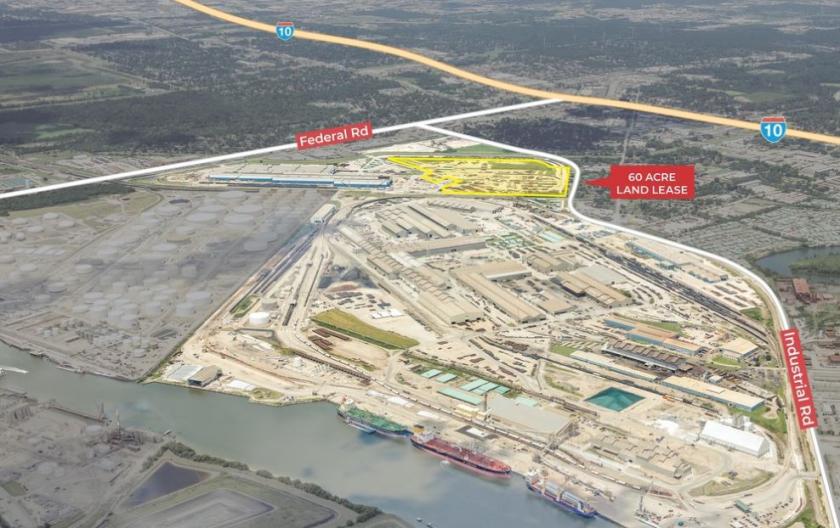
1755 Federal Road Houston, TX 77015
1755 Federal Road Houston, TX 77015
Details & Description
Property Highlights
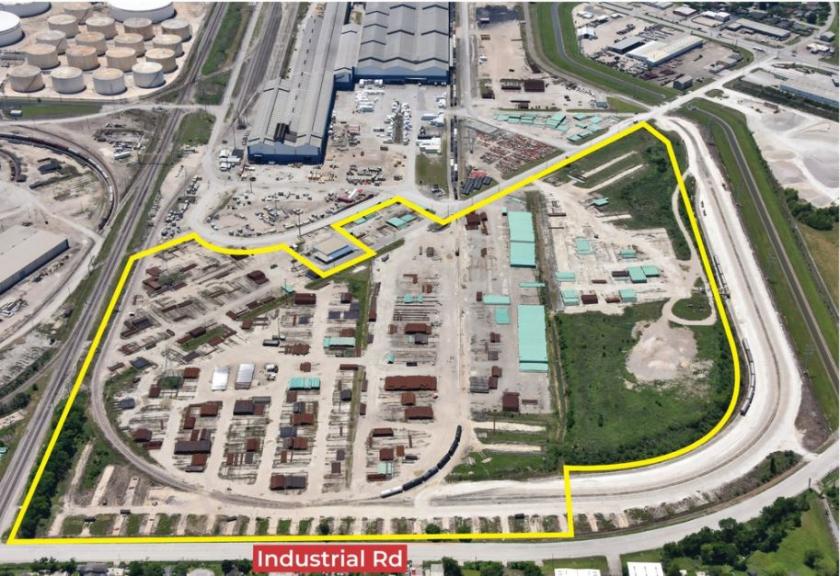
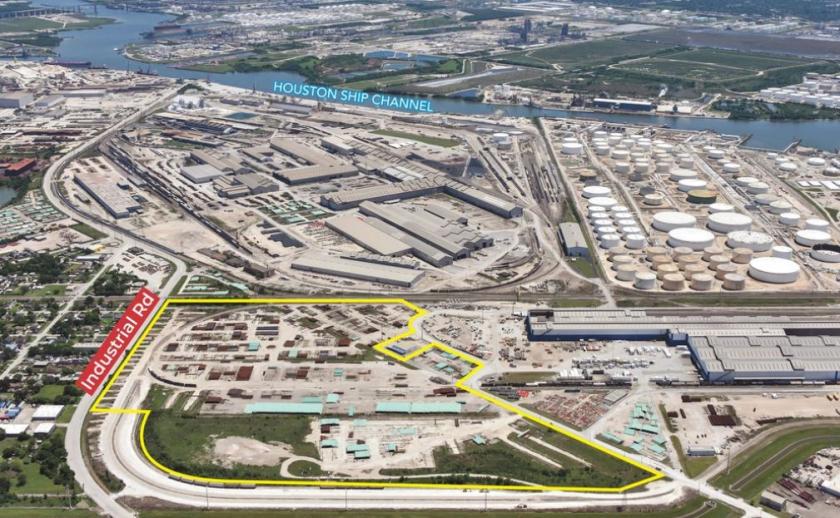
- • 60 acres of land - divisible
- • Majority stabilized
- • Separate entrance possible
- • On-site warehouse space available
- • Can do build-to-suit
- • Located within an IDA
Listing Agents

Gray Gilbert
O: 713-301-7252
gray.gilbert@naipartners.com
O: 713-301-7252
gray.gilbert@naipartners.com

Chris Haro
O: 713-275-9620
chris.haro@naipartners.com
O: 713-275-9620
chris.haro@naipartners.com

Jack Gilbert
NAI Partners
O: 713-275-9657
jack.gilbert@naipartners.com
NAI Partners
O: 713-275-9657
jack.gilbert@naipartners.com
While we strive to provide the most accurate information, all listing information, and demographic data, is provided by third-parties. As such, MyEListing will not be responsible for the accuracy of the information. It is strongly recommended that you verify all information with the listing agent, and any relevant agencies, prior to making any decisions.