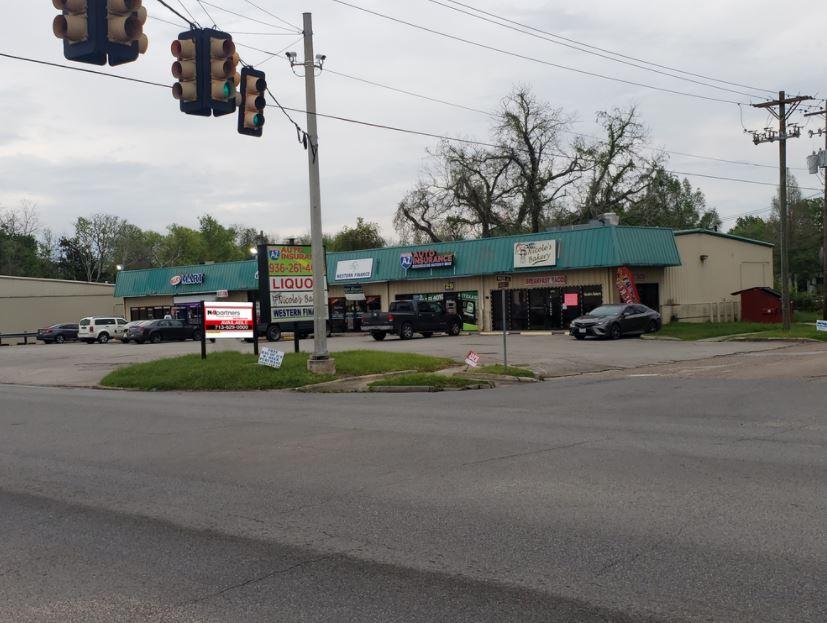
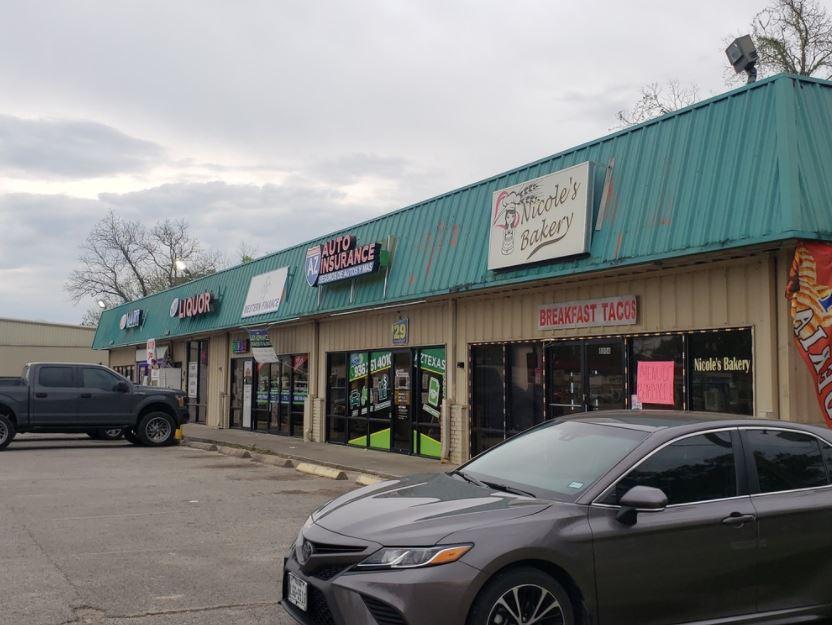
1-Mile | 3-Miles | 5-Miles | ||
---|---|---|---|---|
Total Population | 3,594 | 7,818 | 12,977 | |
Population Median Age | 36 | 36 | 37 | |
Population by Age | 0-9 Yrs | 525 (14%) | 1350 (17%) | 2048 (15%) |
10-19 Yrs | 255 (7%) | 780 (9%) | 1458 (11%) | |
20-29 Yrs | 812 (22%) | 1426 (18%) | 2048 (15%) | |
30-39 Yrs | 638 (17%) | 1047 (13%) | 1522 (11%) | |
40-49 Yrs | 377 (10%) | 864 (11%) | 1555 (11%) | |
50-59 Yrs | 439 (12%) | 1024 (13%) | 1815 (13%) | |
60-69 Yrs | 270 (7%) | 658 (8%) | 1340 (10%) | |
70+ Yrs | 278 (7%) | 670 (8%) | 1189 (9%) | |
Median HH Income | $59,444 | $56,070 | $57,424 | |
Total Household Income | < 24K | 118 (9%) | 381 (13%) | 752 (15%) |
25-49K | 363 (29%) | 697 (25%) | 1086 (22%) | |
50-74K | 259 (21%) | 770 (28%) | 1151 (24%) | |
75-99K | 236 (19%) | 402 (14%) | 769 (16%) | |
100-199K | 190 (15%) | 349 (12%) | 700 (14%) | |
200K+ | 52 (4%) | 140 (5%) | 267 (5%) | |
Highest Education Level | No Diploma | 298 | 637 | 1160 |
Diploma or GED | 718 | 1677 | 2896 | |
Some College | 688 | 1204 | 2069 | |
Assoc. Degree | 191 | 463 | 745 | |
Bachelors Degree | 241 | 461 | 788 | |
Higher Degree | 153 | 338 | 497 | |
Total Housing Units | 1,453 | 3,139 | 5,361 | |
--Owner-Occupied | 588 | 1,710 | 3,419 | |
--Renter-Occupied | 631 | 1,029 | 1,306 | |
Owner-Occupied Values | < 100K | 263 | 803 | 1445 |
100-199K | 248 | 561 | 990 | |
200-299K | 58 | 217 | 591 | |
300-399K | 4 | 70 | 235 | |
400-499K | 14 | 27 | 44 | |
500K+ | 1 | 33 | 114 | |
Total Working Age Population | 2,950 | 5,971 | 10,012 | |
In Work Force | 1,779 | 3,550 | 5,823 | |
Not In Work Force | 1,171 | 2,421 | 4,189 | |
Workforce Employed | 1,669 | 3,257 | 5,413 | |
Workforce Unemployed | 110 | 292 | 410 | |
Civlian Workforce | 1,779 | 3,550 | 5,823 | |
Military Workforce | 0 | 0 | 0 | |
Total Households | 1,219 | 2,739 | 4,725 | |
Family Households | 832 | 1,931 | 3,360 | |
Non-Family Households | 388 | 808 | 1,365 | |
Married Couple | 749 | 1,680 | 2,824 | |
Other Family | 83 | 251 | 536 | |
Married w/Child | 286 | 644 | 1,043 | |
Single Male w/Child | 0 | 0 | 1 | |
Single Female w/Child | 14 | 114 | 246 |
Population Change Last Two Decades - Plus Projection
2000 | % | 2010 | % | 2020 | % | 2030 | |
---|---|---|---|---|---|---|---|
Texas | 20,851,820 | +21 | 25,145,561 | +18 | 29,677,668 | +18 | 34,894,452 |
Hardin County | 48,073 | +14 | 54,635 | +3 | 56,486 | +2 | 57,438 |
Liberty County | 70,154 | +8 | 75,643 | +13 | 85,284 | +12 | 95,433 |
Total Working Age Population:
Total Households:
Total Working Age Population:
Total Households:
Total Working Age Population:
Total Households: