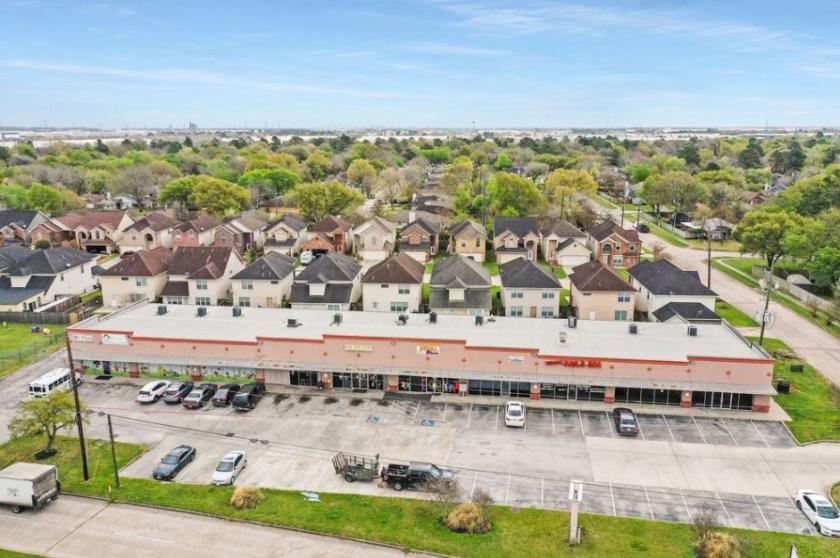
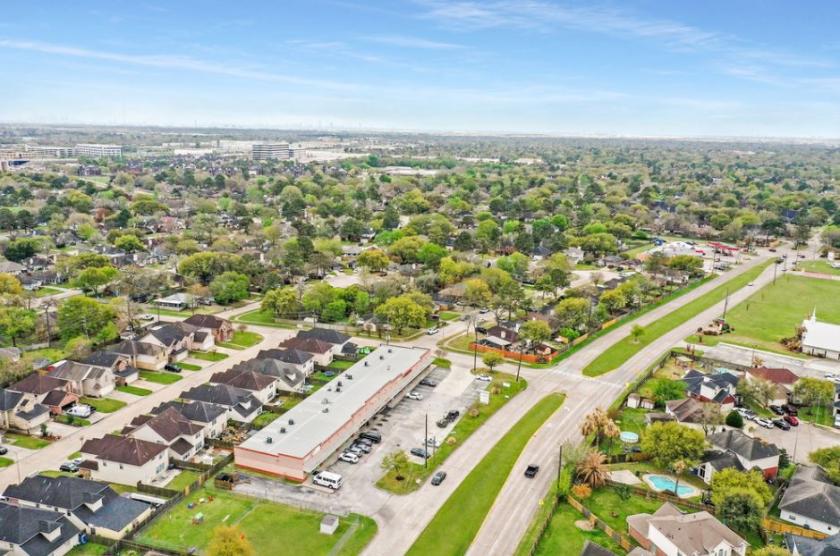
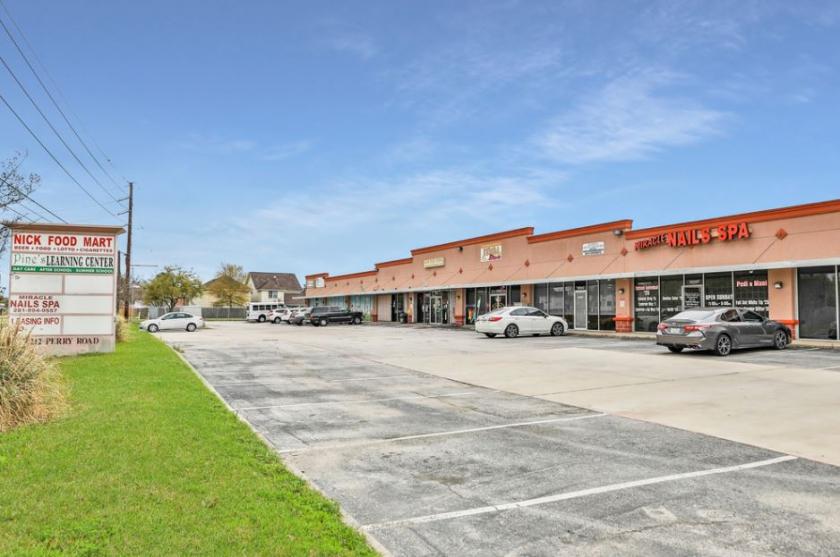
Retail Space
11212 Perry Road Houston, TX 77064
11212 Perry Road Houston, TX 77064
Details & Description
Property Highlights
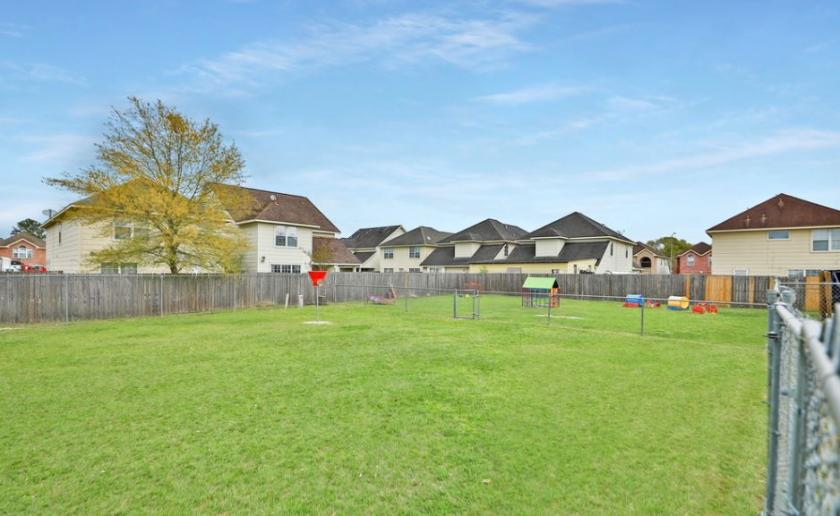
- • Surrounded 360 degrees by single-family homes
- • Recession resistant tenants
- • No zoning restrictions
- • Long-term tenants
Additional Photos

Listing Agents

Davis Aminyisye
O: 713-728-7635
davis.amanyisye@partnersrealestate.com
O: 713-728-7635
davis.amanyisye@partnersrealestate.com
While we strive to provide the most accurate information, all listing information, and demographic data, is provided by third-parties. As such, MyEListing will not be responsible for the accuracy of the information. It is strongly recommended that you verify all information with the listing agent, and any relevant agencies, prior to making any decisions.


