Specialty Real Estate
16505 Condit Road Morgan Hill, CA 95037
16505 Condit Road Morgan Hill, CA 95037
Details & Description
Property Highlights
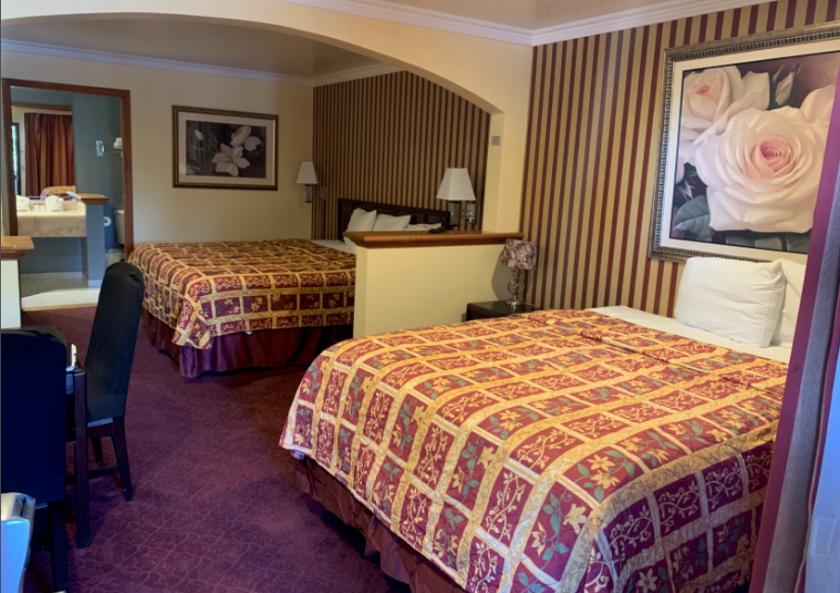
• Property includes 32 standard rooms, junior suites, and jacuzzi rooms
• Potential for owner to develop an additional 53 hotel rooms on site
Listing Agents

Alexander Barker
O: 415-480-0209
M: 707-480-2591
abarker@nainorcal.com
O: 415-480-0209
M: 707-480-2591
abarker@nainorcal.com
While we strive to provide the most accurate information, all listing information, and demographic data, is provided by third-parties. As such, MyEListing will not be responsible for the accuracy of the information. It is strongly recommended that you verify all information with the listing agent, and any relevant agencies, prior to making any decisions.