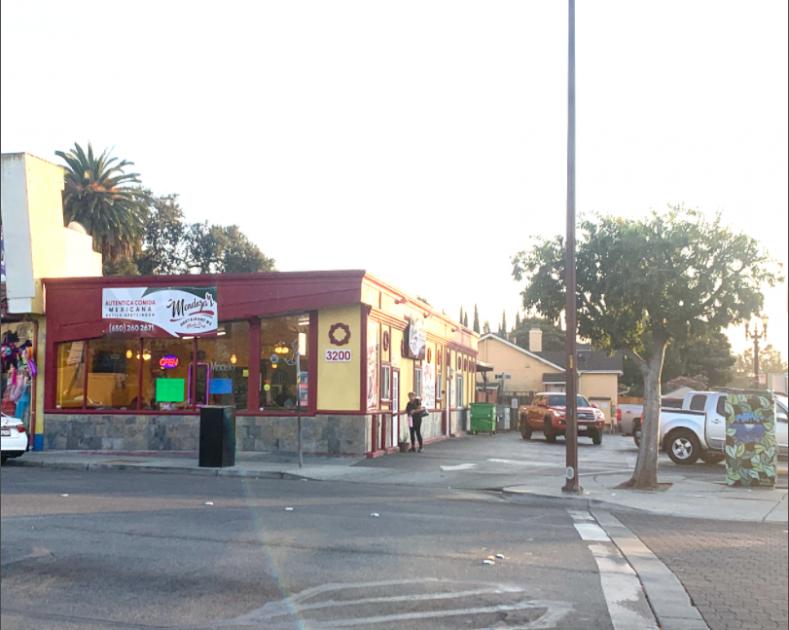
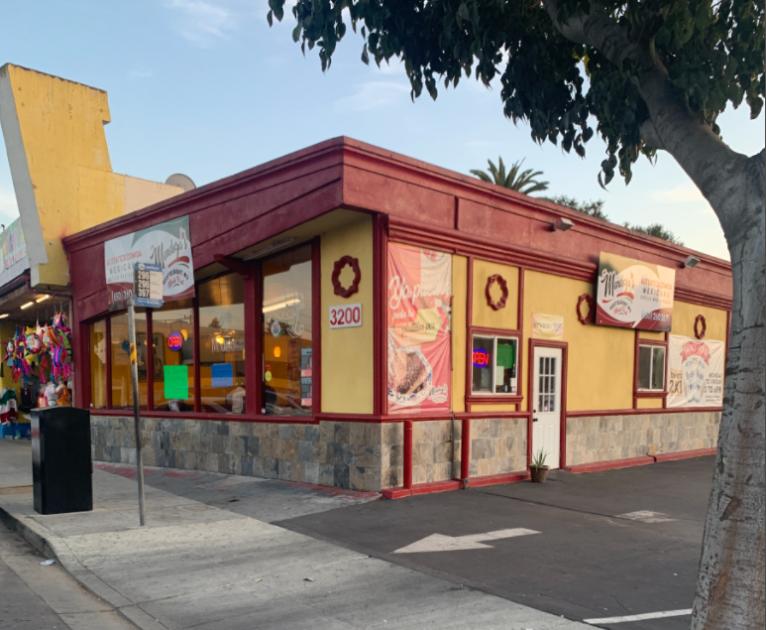
1-Mile | 3-Miles | 5-Miles | ||
---|---|---|---|---|
Total Population | 23,869 | 147,564 | 267,587 | |
Population Median Age | 39 | 37 | 37 | |
Population by Age | 0-9 Yrs | 2659 (11%) | 17302 (11%) | 32480 (12%) |
10-19 Yrs | 3586 (15%) | 20435 (13%) | 35685 (13%) | |
20-29 Yrs | 2741 (11%) | 26114 (17%) | 42841 (16%) | |
30-39 Yrs | 2607 (10%) | 21142 (14%) | 39484 (14%) | |
40-49 Yrs | 3902 (16%) | 19797 (13%) | 36371 (13%) | |
50-59 Yrs | 3440 (14%) | 16232 (10%) | 31124 (11%) | |
60-69 Yrs | 2345 (9%) | 12026 (8%) | 23240 (8%) | |
70+ Yrs | 2589 (10%) | 14516 (9%) | 26361 (9%) | |
Median HH Income | $168,180 | $130,845 | $144,049 | |
Total Household Income | < 24K | 659 (7%) | 6229 (11%) | 9911 (10%) |
25-49K | 620 (7%) | 5971 (11%) | 9493 (9%) | |
50-74K | 756 (8%) | 5000 (9%) | 8883 (9%) | |
75-99K | 797 (9%) | 4630 (8%) | 7515 (7%) | |
100-199K | 2252 (25%) | 13805 (25%) | 25396 (26%) | |
200K+ | 3751 (42%) | 17825 (33%) | 34901 (36%) | |
Highest Education Level | No Diploma | 388 | 8610 | 14163 |
Diploma or GED | 576 | 7199 | 15185 | |
Some College | 1306 | 8660 | 17270 | |
Assoc. Degree | 573 | 3569 | 7143 | |
Bachelors Degree | 4860 | 26070 | 49975 | |
Higher Degree | 8631 | 43391 | 76233 | |
Total Housing Units | 9,158 | 57,298 | 103,125 | |
--Owner-Occupied | 5,242 | 24,714 | 48,786 | |
--Renter-Occupied | 3,592 | 28,747 | 47,313 | |
Owner-Occupied Values | < 100K | 93 | 418 | 840 |
100-199K | 107 | 497 | 796 | |
200-299K | 3 | 212 | 501 | |
300-399K | 33 | 251 | 679 | |
400-499K | 0 | 238 | 517 | |
500K+ | 5007 | 23098 | 45453 | |
Total Working Age Population | 18,747 | 119,439 | 214,730 | |
In Work Force | 12,280 | 77,847 | 141,898 | |
Not In Work Force | 6,467 | 41,592 | 72,832 | |
Workforce Employed | 11,942 | 75,271 | 136,542 | |
Workforce Unemployed | 338 | 2,515 | 5,137 | |
Civlian Workforce | 12,280 | 77,786 | 141,679 | |
Military Workforce | 0 | 62 | 219 | |
Total Households | 8,835 | 53,461 | 96,099 | |
Family Households | 6,430 | 33,175 | 61,549 | |
Non-Family Households | 2,405 | 20,286 | 34,550 | |
Married Couple | 5,060 | 26,623 | 50,065 | |
Other Family | 1,369 | 6,552 | 11,485 | |
Married w/Child | 2,710 | 13,087 | 24,408 | |
Single Male w/Child | 234 | 926 | 1,414 | |
Single Female w/Child | 495 | 2,476 | 4,155 |
Population Change Last Two Decades - Plus Projection
2000 | % | 2010 | % | 2020 | % | 2030 | |
---|---|---|---|---|---|---|---|
California | 33,871,648 | +10 | 37,253,956 | +9 | 40,467,295 | +8 | 43,631,295 |
Alameda County | 1,443,741 | +5 | 1,510,271 | +12 | 1,696,752 | +10 | 1,861,027 |
San Mateo County | 707,161 | +2 | 718,451 | +9 | 785,650 | +6 | 833,868 |
Santa Clara County | 1,682,585 | +6 | 1,781,642 | +12 | 1,996,394 | +10 | 2,194,079 |
Total Working Age Population:
Total Households:
Total Working Age Population:
Total Households:
Total Working Age Population:
Total Households: