Commercial Land
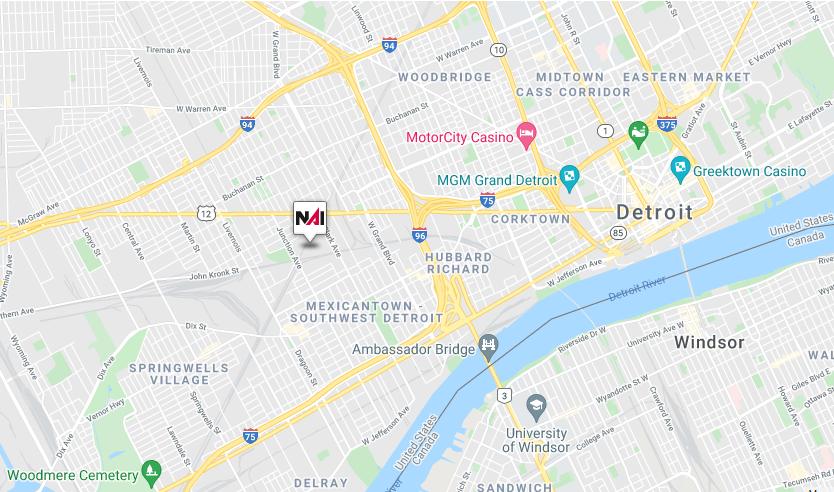
Clark Street and Michagan Ave Detroit, MI 48210
Clark Street and Michagan Ave Detroit, MI 48210
Details & Description
Property Highlights
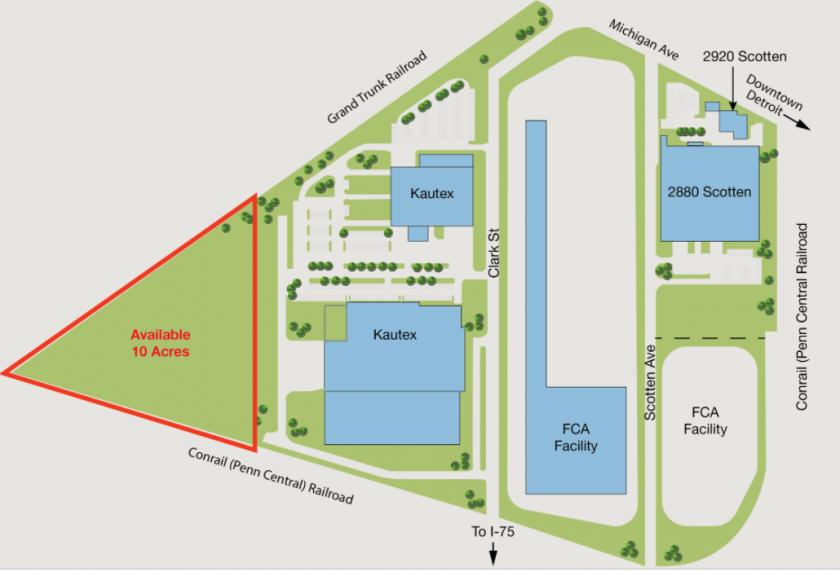
- • Build to Suit
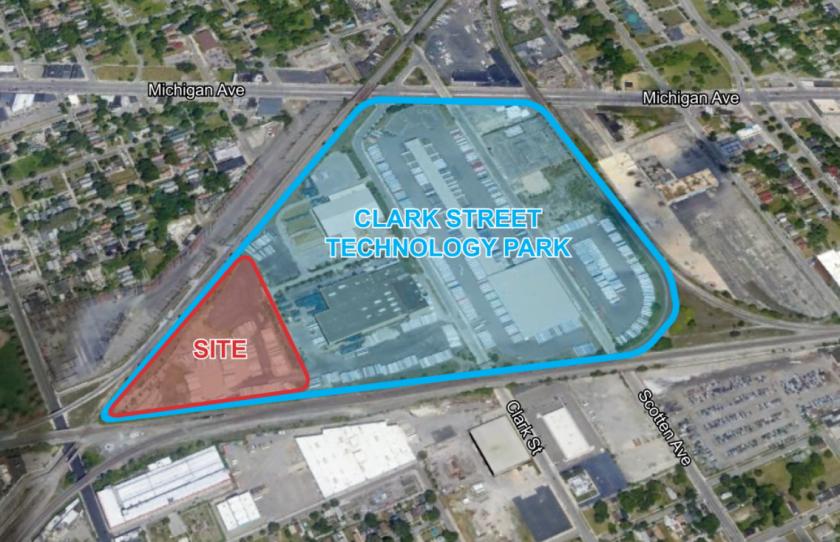
- • Close Proximity to Ambassador Bridge and Rail Yard
- • Sale or Lease
- • Ground Lease Available For Trailer Truck Parking
Listing Agents
Daniel McCleary
O: 248-351-4384
M: 248-770-3969
mccleary@farbman.com
O: 248-351-4384
M: 248-770-3969
mccleary@farbman.com

Albert Ellis
O: 586-822-2909
albert.ellis@cushwake.com
O: 586-822-2909
albert.ellis@cushwake.com

Paul DeBono
O: 248-470-3015
PaulDebono@BeanstalkRES.com
O: 248-470-3015
PaulDebono@BeanstalkRES.com
While we strive to provide the most accurate information, all listing information, and demographic data, is provided by third-parties. As such, MyEListing will not be responsible for the accuracy of the information. It is strongly recommended that you verify all information with the listing agent, and any relevant agencies, prior to making any decisions.