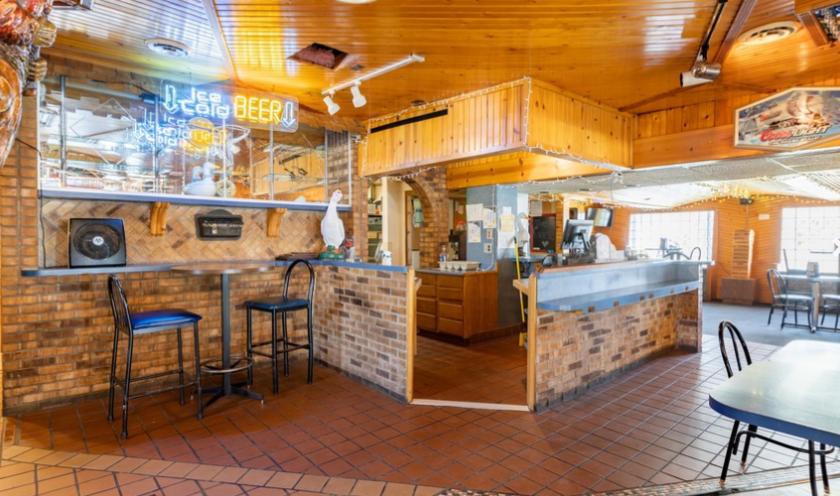
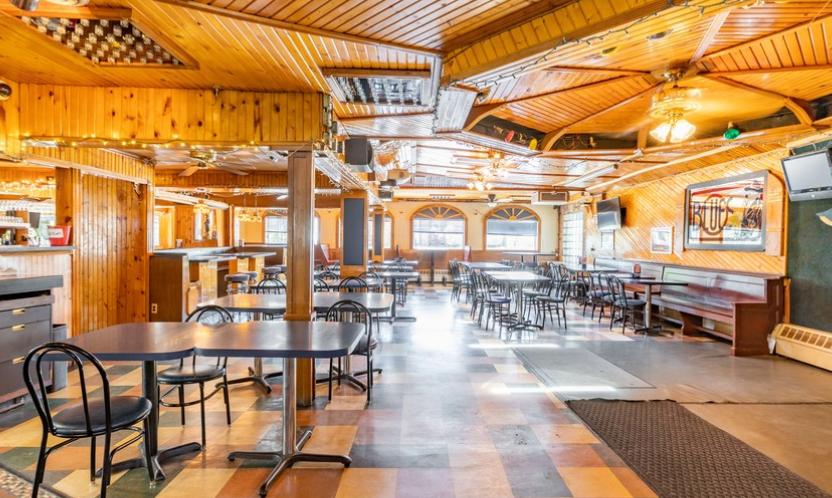
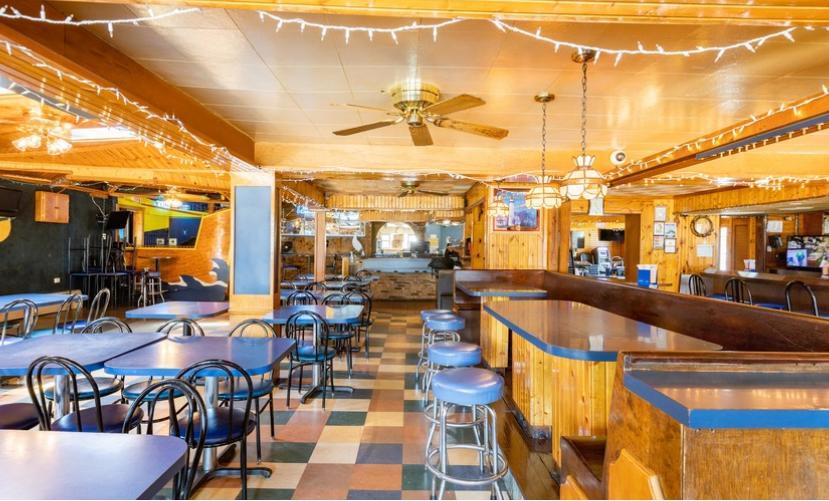
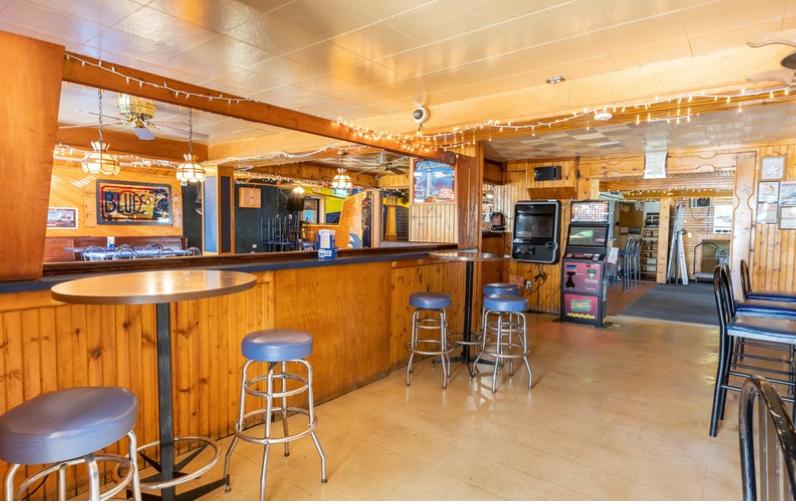
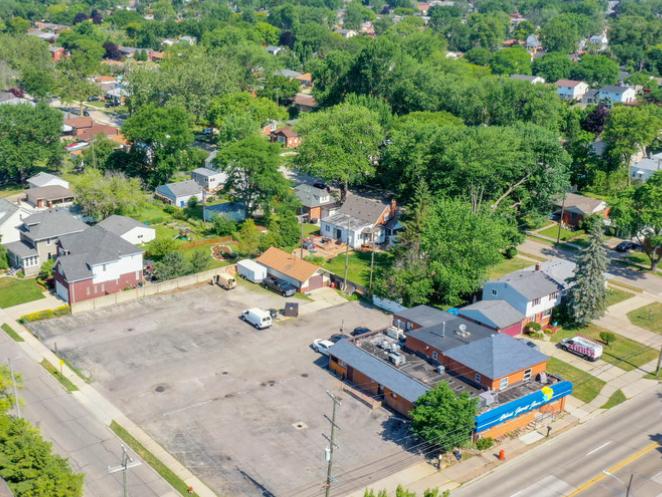
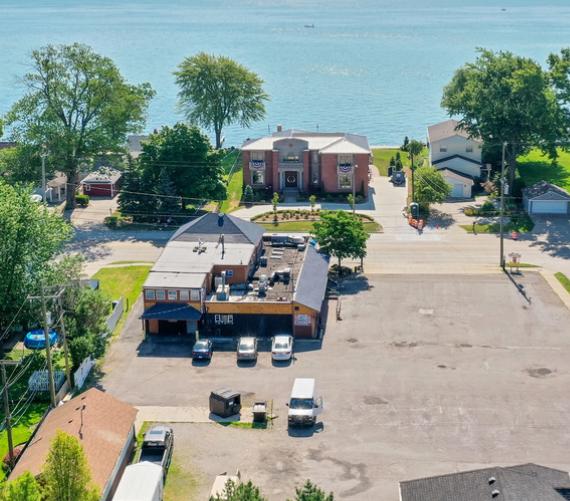
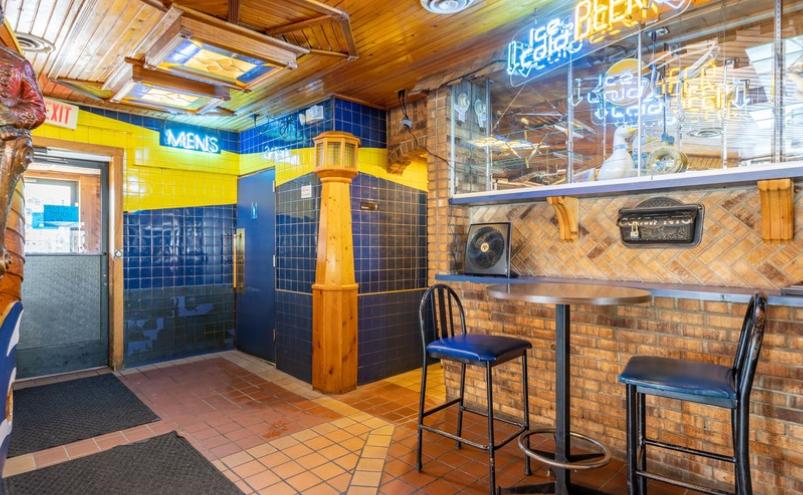
Retail Space
28911 Jefferson Avenue St Clair Shores, MI 48081
28911 Jefferson Avenue St Clair Shores, MI 48081
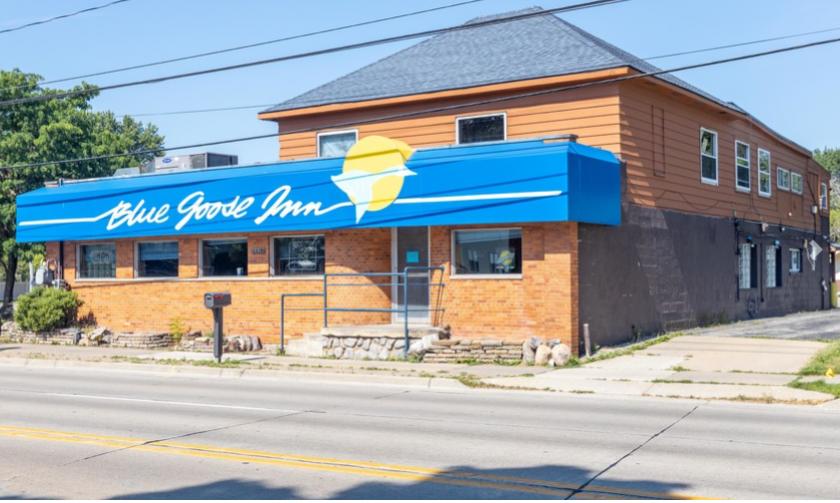
Details & Description
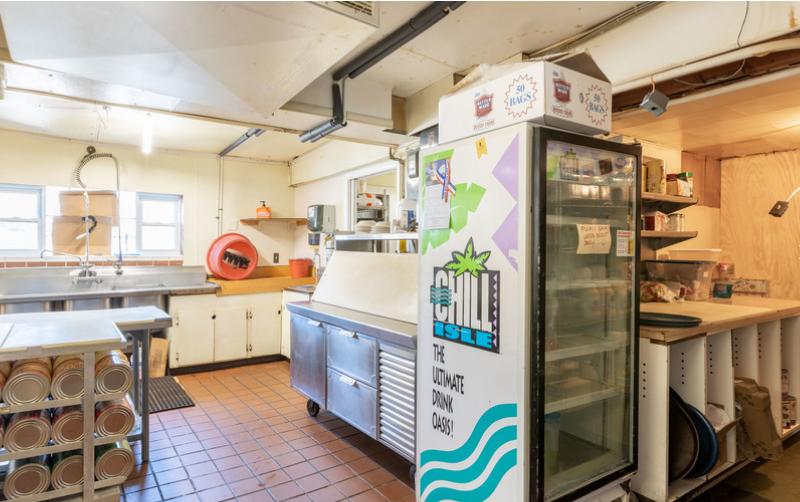
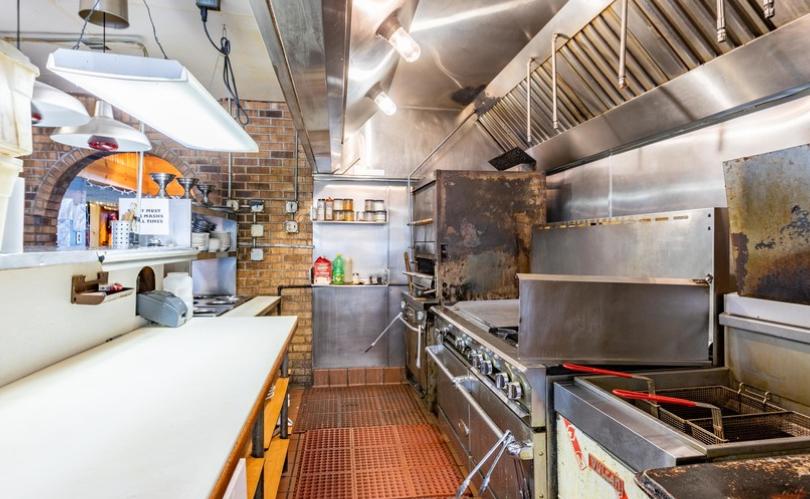
Property Highlights
- • RestaurantBar Available
- • Sale Includes Liquor License
- • Ample On-site Parking
- • Turnkey Operation
- • Includes Furniture, Fixtures Equipment
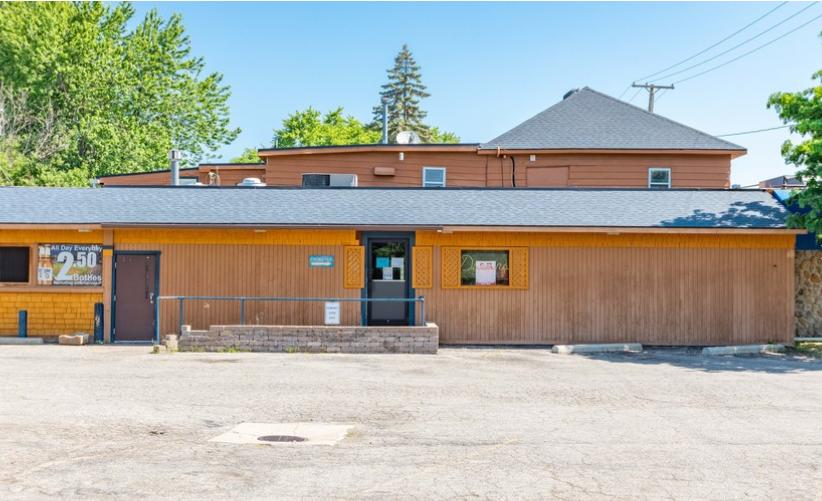
Additional Photos
Listing Agents

Dan Callaway
O: 248-230-8037
M: 313-595-0435
callaway@farbman.com
O: 248-230-8037
M: 313-595-0435
callaway@farbman.com
While we strive to provide the most accurate information, all listing information, and demographic data, is provided by third-parties. As such, MyEListing will not be responsible for the accuracy of the information. It is strongly recommended that you verify all information with the listing agent, and any relevant agencies, prior to making any decisions.