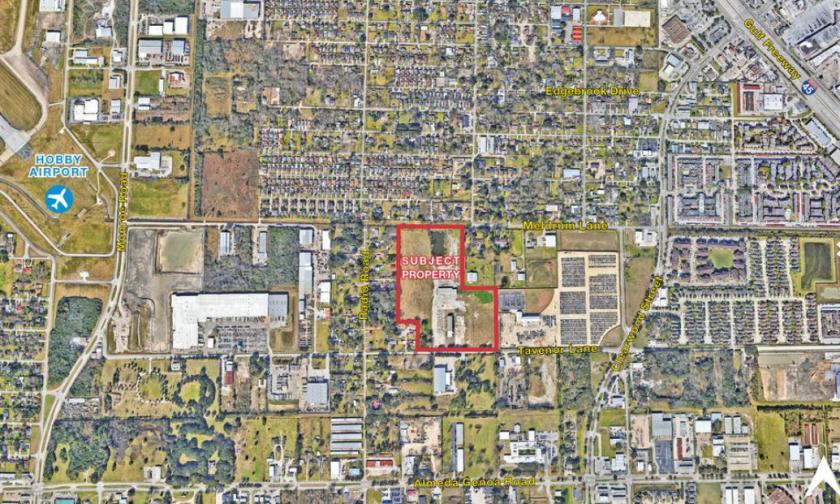
Commercial Land
9201 Tavenor Lane Houston, TX 77075
9201 Tavenor Lane Houston, TX 77075
Details & Description
Property Highlights
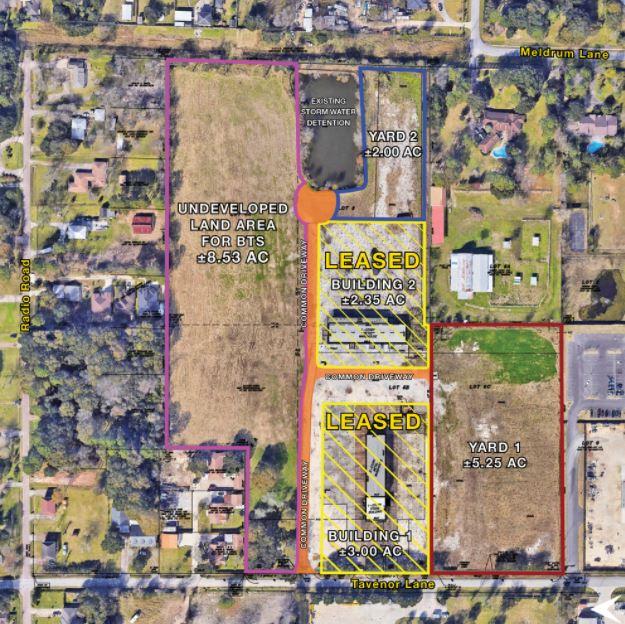
- • 24,615 SF Buildings Leased
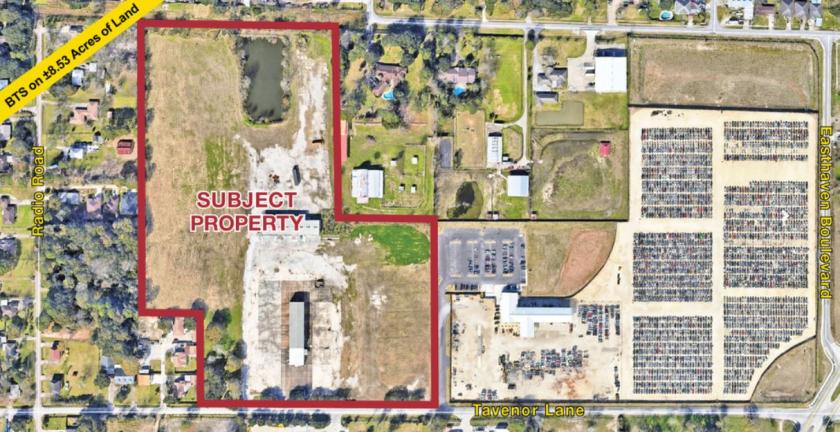
- • 7.25 Acres Yard Available Two Tracts
- • Dock-High Loading Wells Can be Provided
- • 8.53 Acres of Unimproved Land Available
- • Professionally Managed Property
Listing Agents

Clay Pritchett
O: 713-985-4631
clay.pritchett@naipartners.com
O: 713-985-4631
clay.pritchett@naipartners.com

Zane Carman
O: 713-985-4418
M: 409-789-9029
zane.carman@partnersrealestate.com
O: 713-985-4418
M: 409-789-9029
zane.carman@partnersrealestate.com
While we strive to provide the most accurate information, all listing information, and demographic data, is provided by third-parties. As such, MyEListing will not be responsible for the accuracy of the information. It is strongly recommended that you verify all information with the listing agent, and any relevant agencies, prior to making any decisions.