Industrial Properties
1010 Bade Street Houston, TX 77055
1010 Bade Street Houston, TX 77055
Details & Description
Property Highlights
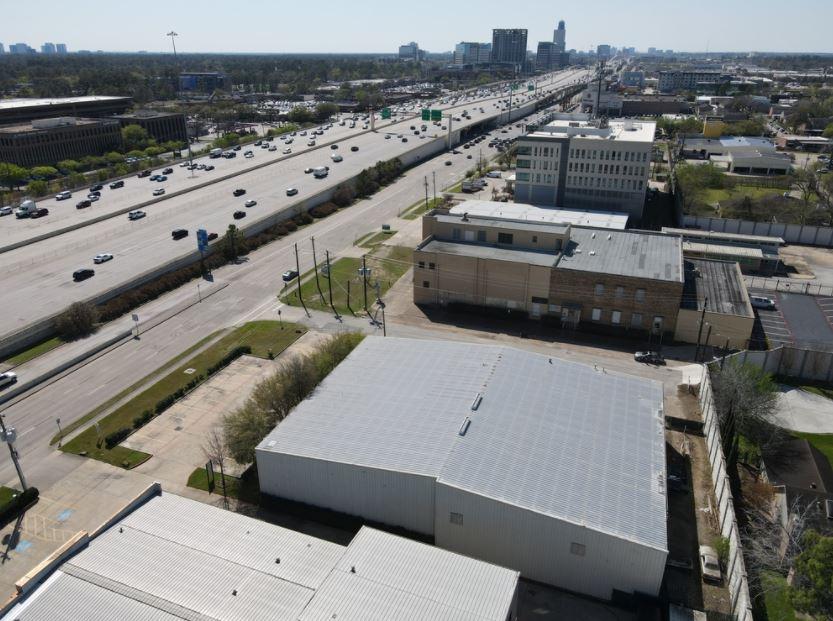
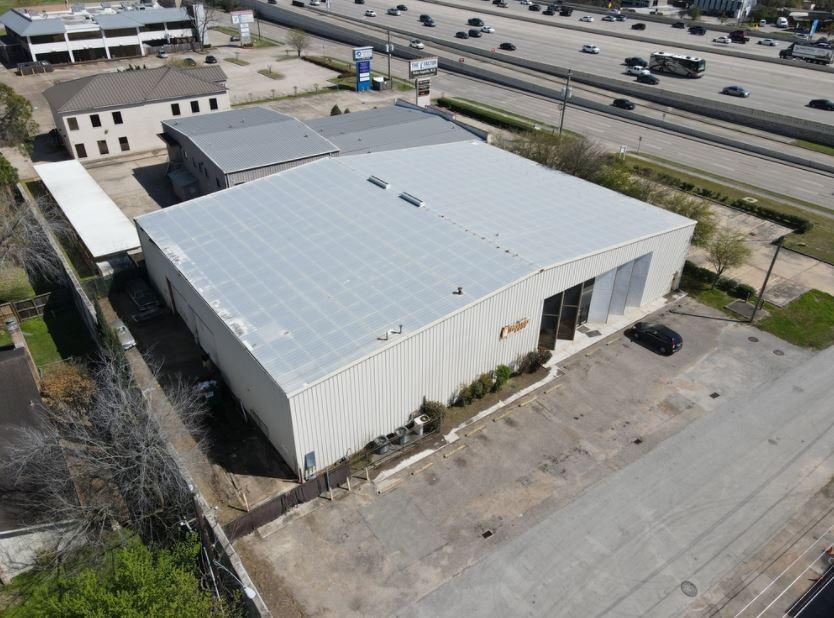
- • 14,560 SF Metal Warehouse on 20,304 SF Lot
- • One Dock Well
- • Frontage to Katy Freeway
- • Versatile Buildout
- • Redevelopment of Memorial City Mall Underway
Listing Agents

Cary Latham
O: 713-629-0500
M: 713-360-1686
cary.latham@partnersrealestate.com
O: 713-629-0500
M: 713-360-1686
cary.latham@partnersrealestate.com

Wyatt Huff
O: 713-597-2604
wyatt.huff@partnersrealestate.com
O: 713-597-2604
wyatt.huff@partnersrealestate.com
While we strive to provide the most accurate information, all listing information, and demographic data, is provided by third-parties. As such, MyEListing will not be responsible for the accuracy of the information. It is strongly recommended that you verify all information with the listing agent, and any relevant agencies, prior to making any decisions.