Industrial Properties
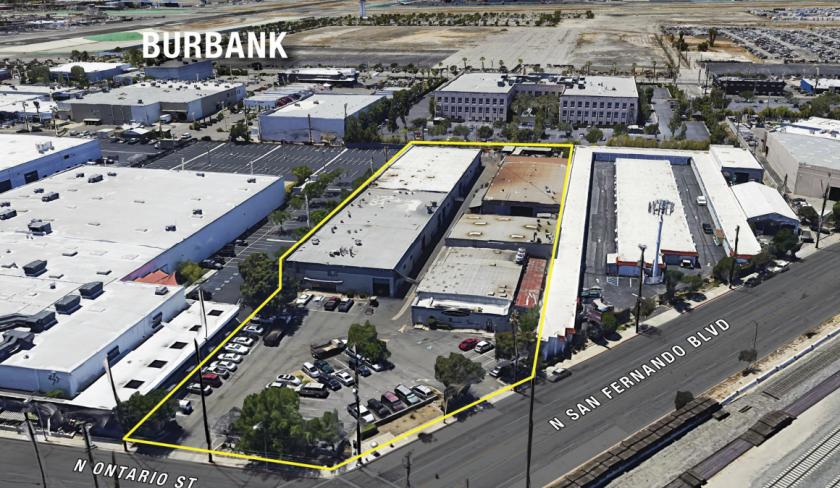
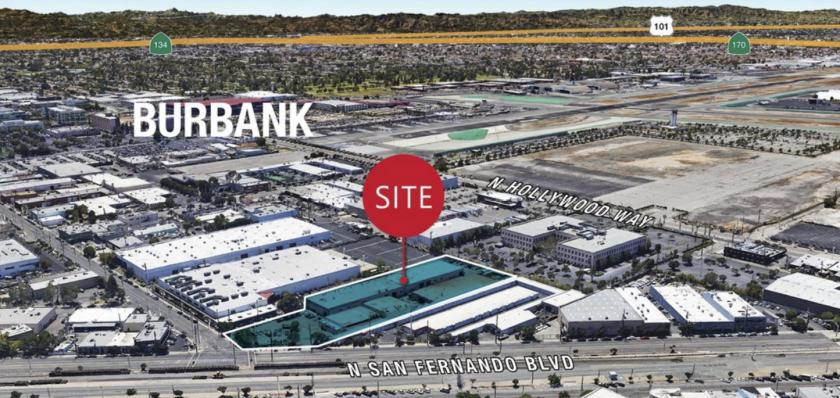
3101 North San Fernando Boulevard Burbank, CA 91504
3101 North San Fernando Boulevard Burbank, CA 91504
Details & Description
Property Highlights
- • No City Income Tax
- • Hollywood Burbank Airport Adjacent
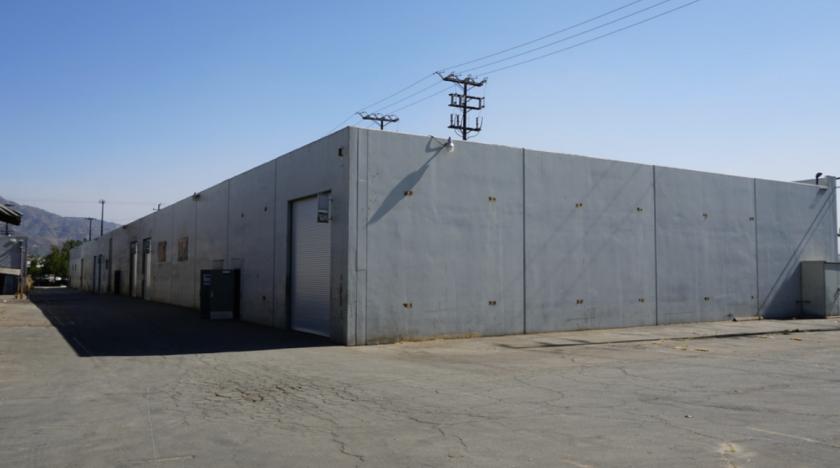
- • Up to 19 Clearance Height
- • 2800 Amp, 480 Volt, 3-Phase, 4-Wire Power
- • Gross Sales Receipt Tax Exemption
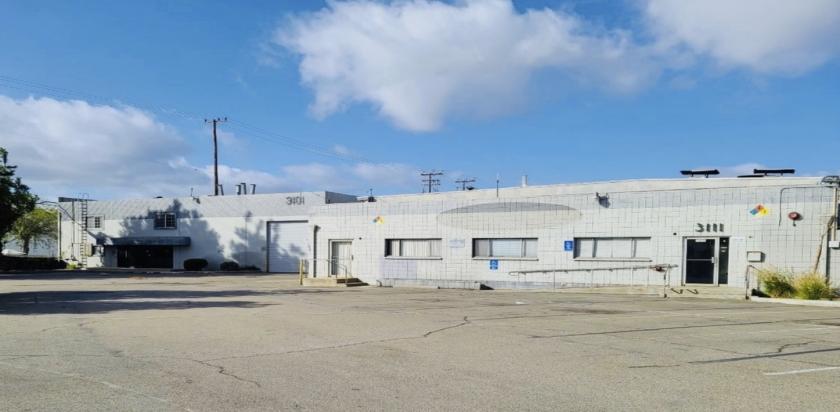
Additional Photos
Listing Agents

Mike Zugsmith
O: 818-907-4683
M: 818-207-0024
mike.zugsmith@cbre.com
O: 818-907-4683
M: 818-207-0024
mike.zugsmith@cbre.com
While we strive to provide the most accurate information, all listing information, and demographic data, is provided by third-parties. As such, MyEListing will not be responsible for the accuracy of the information. It is strongly recommended that you verify all information with the listing agent, and any relevant agencies, prior to making any decisions.


