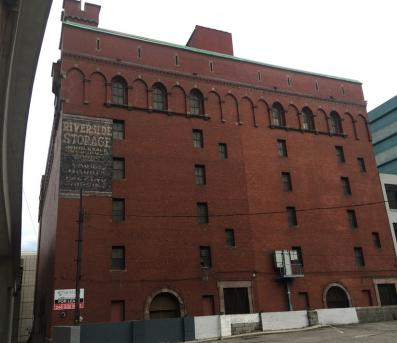
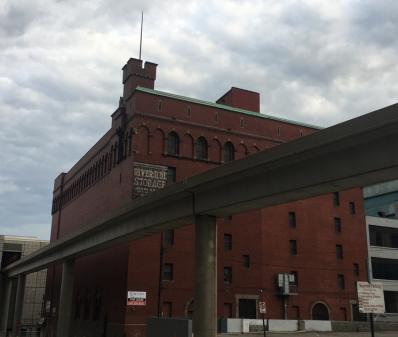
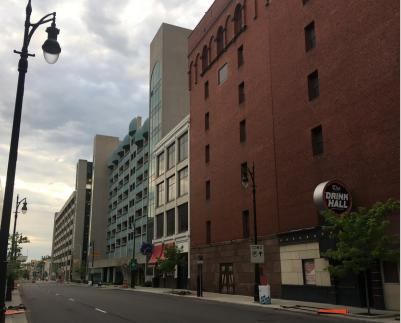
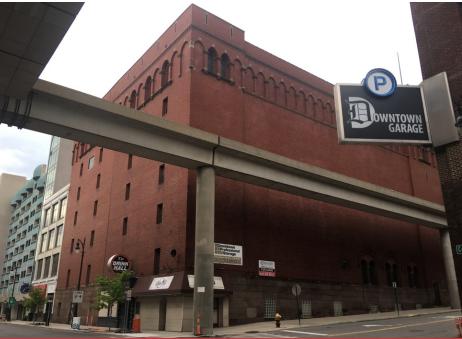
Office Space
623 Cass Avenue Detroit, MI 48226
623 Cass Avenue Detroit, MI 48226
Details & Description
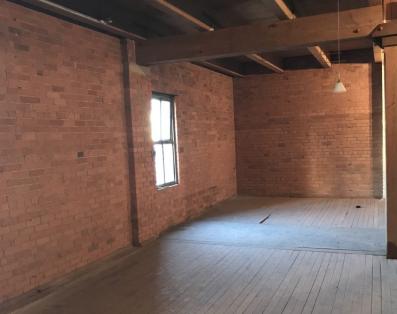
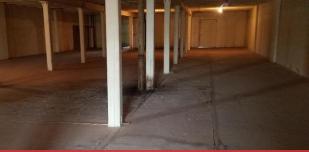
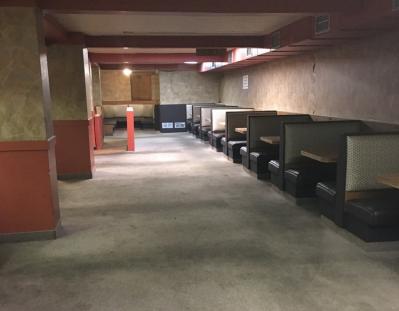
Property Highlights
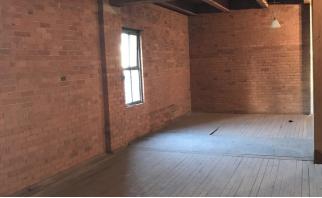
- • 7-Story Building Containing 96,600 SF in CBD
- • Proposals Being Accepted For Purchase or Lease
- • Loft Style Brick Beam Building
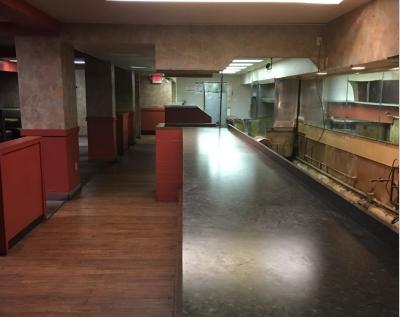
- • 1st Floor Retail Space Available
- • Lease Rate Contact Listing Broker
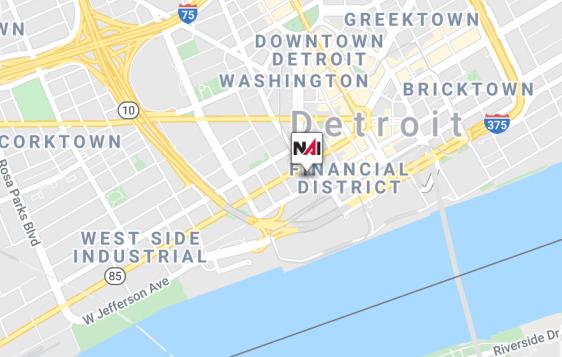
- • Located within 6 blocks of Campus Martius
Additional Photos

Listing Agents

Dan Callaway
O: 248-230-8037
M: 313-595-0435
callaway@farbman.com
O: 248-230-8037
M: 313-595-0435
callaway@farbman.com
While we strive to provide the most accurate information, all listing information, and demographic data, is provided by third-parties. As such, MyEListing will not be responsible for the accuracy of the information. It is strongly recommended that you verify all information with the listing agent, and any relevant agencies, prior to making any decisions.