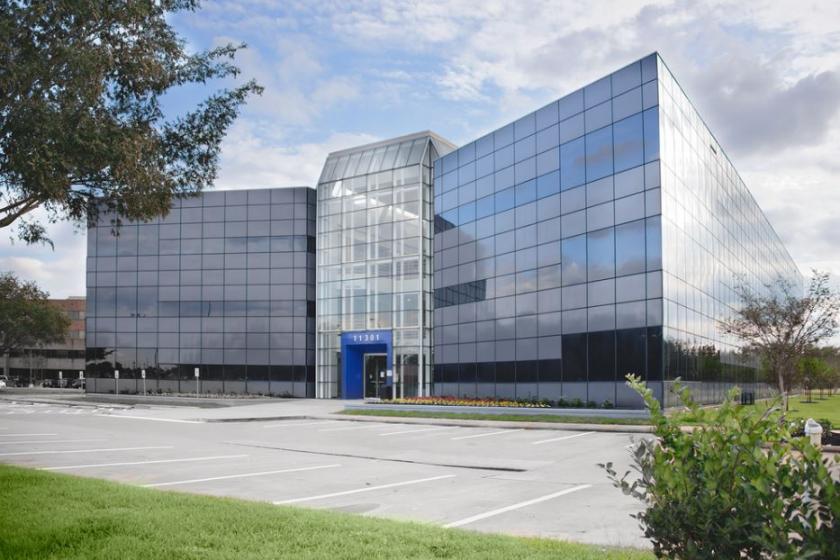
Office Space
11301 Fallbrook Drive Houston, TX 77065
11301 Fallbrook Drive Houston, TX 77065
Details & Description
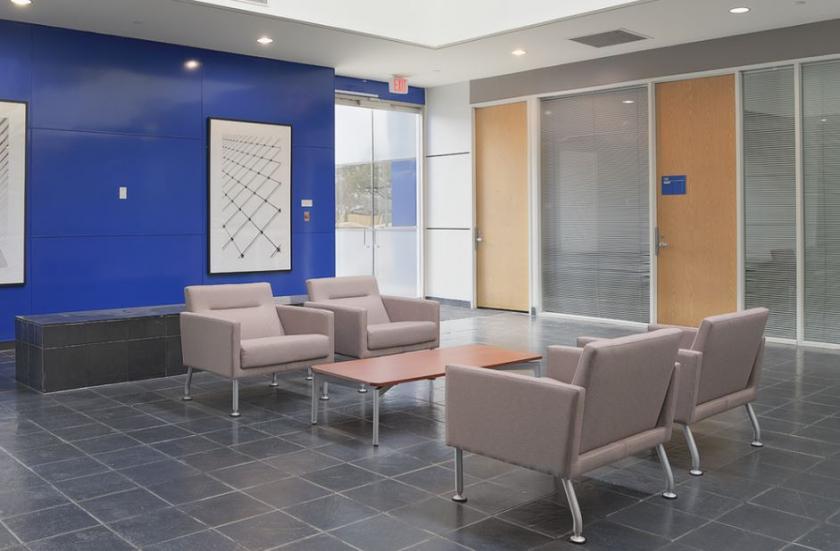
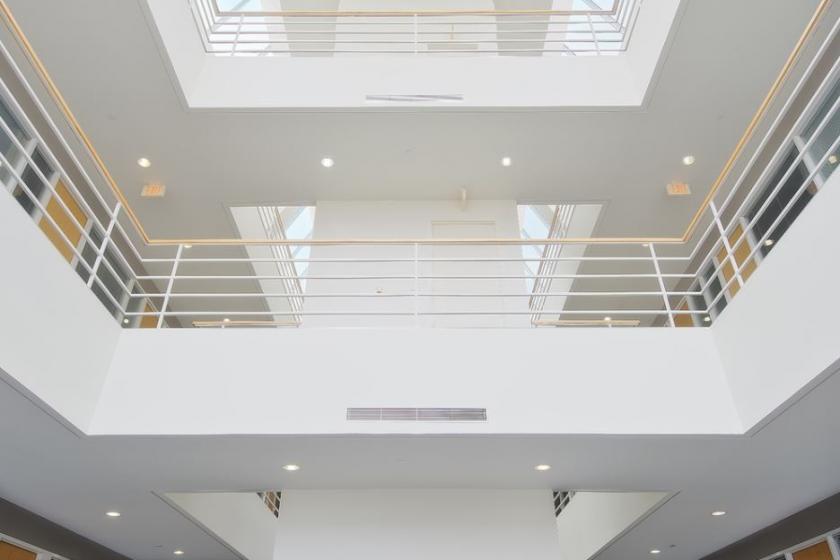
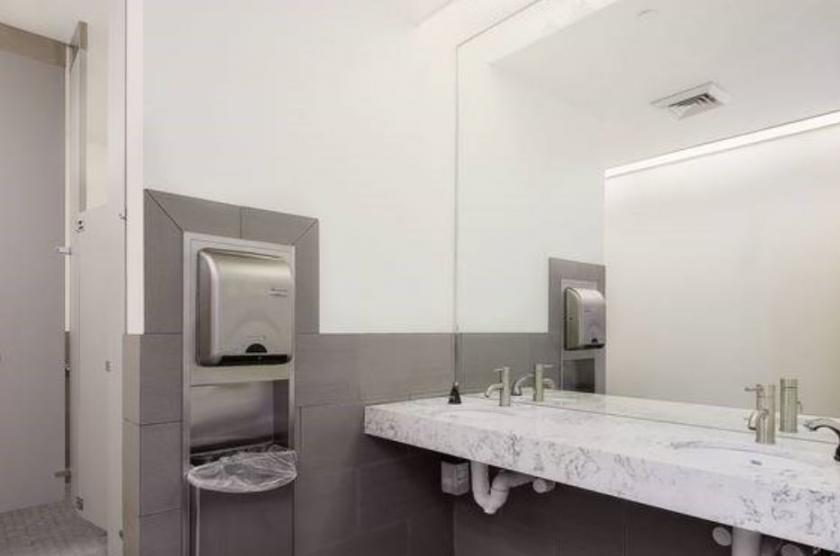
Additional Photos

Listing Agents

Andy Parrish
O: 713-275-9609
andy.parrish@partnersrealestate.com
O: 713-275-9609
andy.parrish@partnersrealestate.com

Lesley Rice
O: 713-275-9611
lesley.rice@partnersrealestate.com
O: 713-275-9611
lesley.rice@partnersrealestate.com
While we strive to provide the most accurate information, all listing information, and demographic data, is provided by third-parties. As such, MyEListing will not be responsible for the accuracy of the information. It is strongly recommended that you verify all information with the listing agent, and any relevant agencies, prior to making any decisions.


