Retail Space
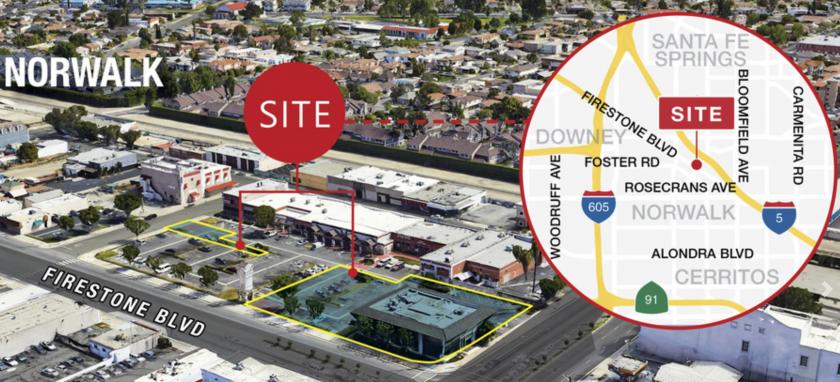
12100 Firestone Boulevard Norwalk, CA 90650
12100 Firestone Boulevard Norwalk, CA 90650
Details & Description
Property Highlights
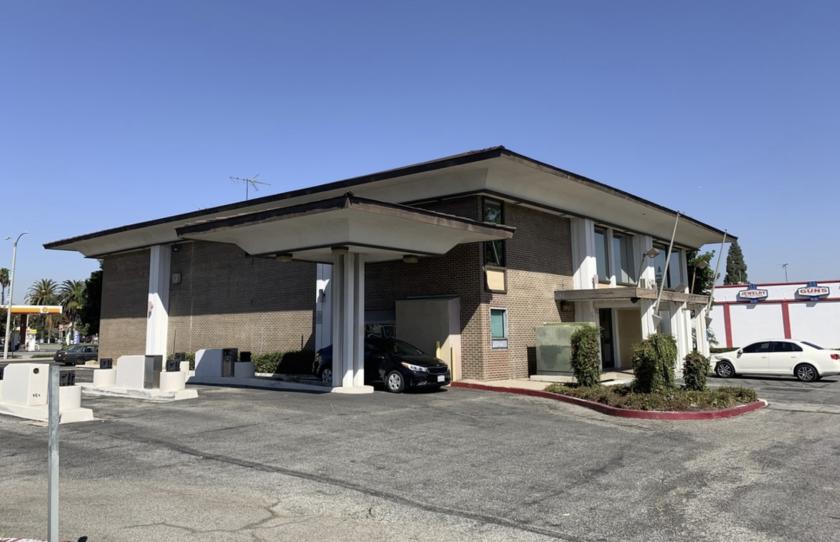
- • Vacant Bank Building w Drive Thru
- • Proximity to Norwalk Courthouse and City Hall
- • Retail Pad for Purchase or Ground Lease
- • Immediate Access to 5 Freeway
Listing Agents

Joshua Cohan
O: 818-742-1649
M: 818-726-7364
jcohan@naicapital.com
O: 818-742-1649
M: 818-726-7364
jcohan@naicapital.com
While we strive to provide the most accurate information, all listing information, and demographic data, is provided by third-parties. As such, MyEListing will not be responsible for the accuracy of the information. It is strongly recommended that you verify all information with the listing agent, and any relevant agencies, prior to making any decisions.