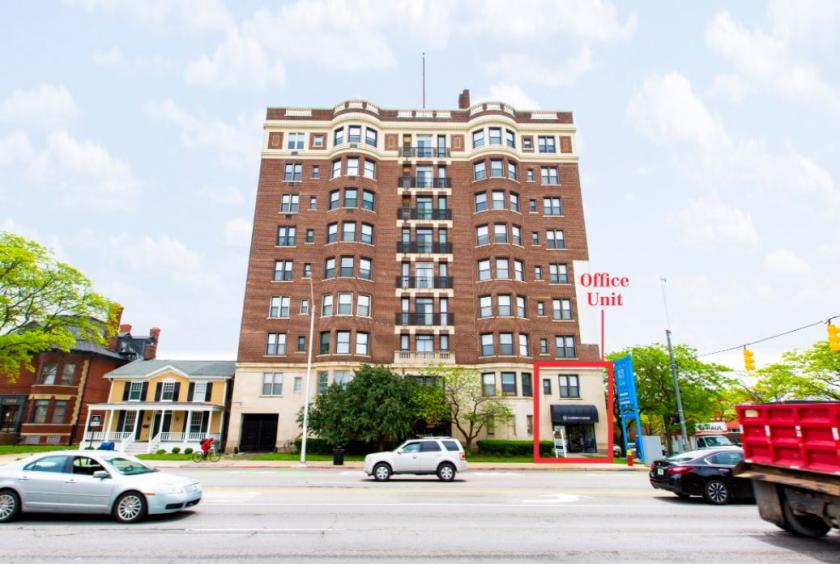
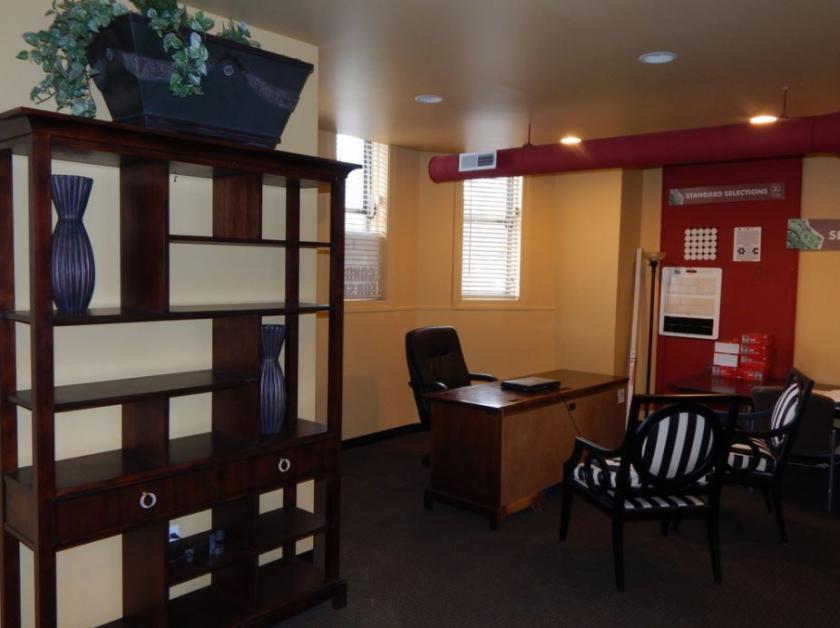
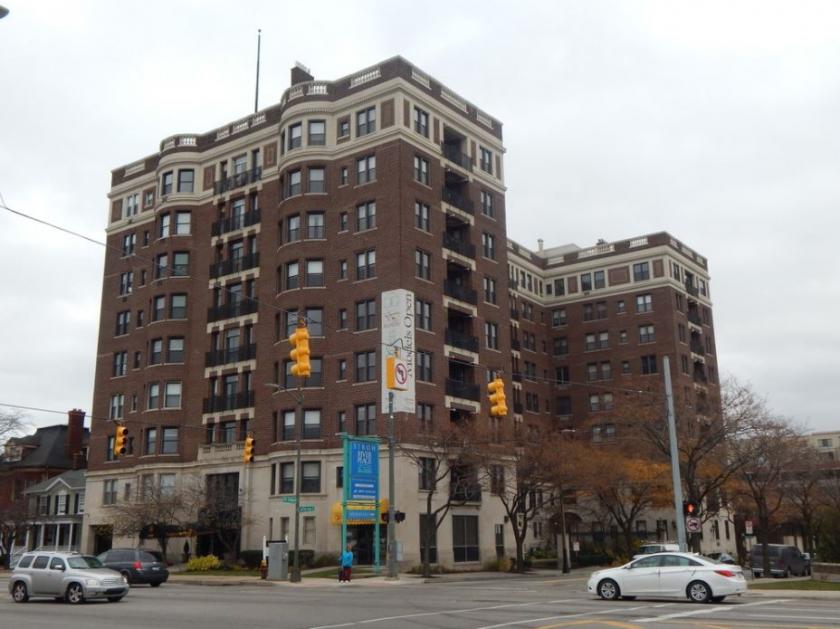
1-Mile | 3-Miles | 5-Miles | ||
---|---|---|---|---|
Total Population | 15,582 | 79,058 | 182,116 | |
Population Median Age | 42 | 42 | 39 | |
Population by Age | 0-9 Yrs | 1419 (9%) | 5985 (7%) | 21324 (11%) |
10-19 Yrs | 1012 (6%) | 5812 (7%) | 19855 (10%) | |
20-29 Yrs | 3222 (20%) | 17684 (22%) | 33716 (18%) | |
30-39 Yrs | 1996 (12%) | 10779 (13%) | 24097 (13%) | |
40-49 Yrs | 1635 (10%) | 7698 (9%) | 19622 (10%) | |
50-59 Yrs | 1844 (11%) | 9513 (12%) | 22894 (12%) | |
60-69 Yrs | 2371 (15%) | 12692 (16%) | 23269 (12%) | |
70+ Yrs | 2083 (13%) | 8893 (11%) | 17337 (9%) | |
Median HH Income | $34,638 | $32,625 | $29,622 | |
Total Household Income | < 24K | 3721 (38%) | 17738 (41%) | 36523 (44%) |
25-49K | 2385 (24%) | 9920 (23%) | 19377 (23%) | |
50-74K | 1395 (14%) | 5428 (12%) | 10221 (12%) | |
75-99K | 868 (8%) | 3964 (9%) | 6514 (7%) | |
100-199K | 1020 (10%) | 4532 (10%) | 7301 (8%) | |
200K+ | 307 (3%) | 1440 (3%) | 2198 (2%) | |
Highest Education Level | No Diploma | 1064 | 8329 | 23916 |
Diploma or GED | 2195 | 12951 | 33709 | |
Some College | 2680 | 13540 | 28302 | |
Assoc. Degree | 778 | 3620 | 7365 | |
Bachelors Degree | 2737 | 11613 | 17990 | |
Higher Degree | 2644 | 10084 | 14377 | |
Total Housing Units | 11,104 | 55,175 | 111,533 | |
--Owner-Occupied | 2,025 | 10,362 | 27,238 | |
--Renter-Occupied | 7,671 | 32,659 | 54,896 | |
Owner-Occupied Values | < 100K | 690 | 5423 | 17012 |
100-199K | 544 | 1663 | 4459 | |
200-299K | 399 | 1447 | 2669 | |
300-399K | 272 | 1031 | 1526 | |
400-499K | 62 | 312 | 595 | |
500K+ | 58 | 486 | 978 | |
Total Working Age Population | 13,472 | 70,411 | 150,174 | |
In Work Force | 7,819 | 38,395 | 78,572 | |
Not In Work Force | 5,653 | 32,016 | 71,602 | |
Workforce Employed | 6,902 | 35,251 | 70,046 | |
Workforce Unemployed | 917 | 3,123 | 8,482 | |
Civlian Workforce | 7,819 | 38,374 | 78,528 | |
Military Workforce | 0 | 21 | 44 | |
Total Households | 9,696 | 43,021 | 82,134 | |
Family Households | 2,838 | 12,022 | 32,174 | |
Non-Family Households | 6,859 | 30,999 | 49,960 | |
Married Couple | 1,048 | 5,240 | 14,595 | |
Other Family | 1,789 | 6,782 | 17,579 | |
Married w/Child | 130 | 754 | 5,283 | |
Single Male w/Child | 19 | 231 | 1,135 | |
Single Female w/Child | 967 | 2,839 | 7,472 |
Population Change Last Two Decades - Plus Projection
2000 | % | 2010 | % | 2020 | % | 2030 | |
---|---|---|---|---|---|---|---|
Michigan | 9,938,444 | -1 | 9,883,640 | +1 | 10,023,423 | +4 | 10,424,510 |
Wayne County | 2,061,162 | -12 | 1,820,584 | -4 | 1,741,463 | -1 | 1,730,000 |
Total Working Age Population:
Total Households:
Total Working Age Population:
Total Households:
Total Working Age Population:
Total Households: