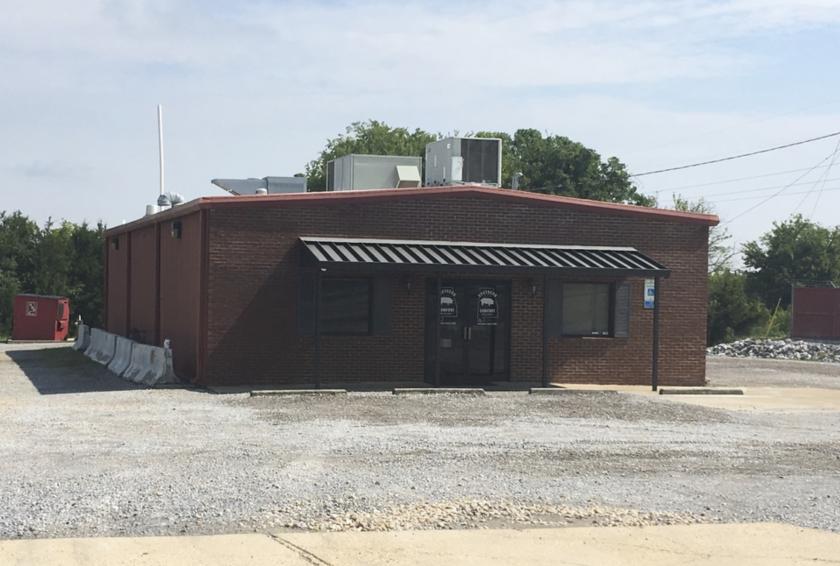
Retail Space
210 Wasden Road Hope Hull, AL 36043
210 Wasden Road Hope Hull, AL 36043
Details & Description
Property Highlights
- • Payroll and Food Costs Within Industry Standards
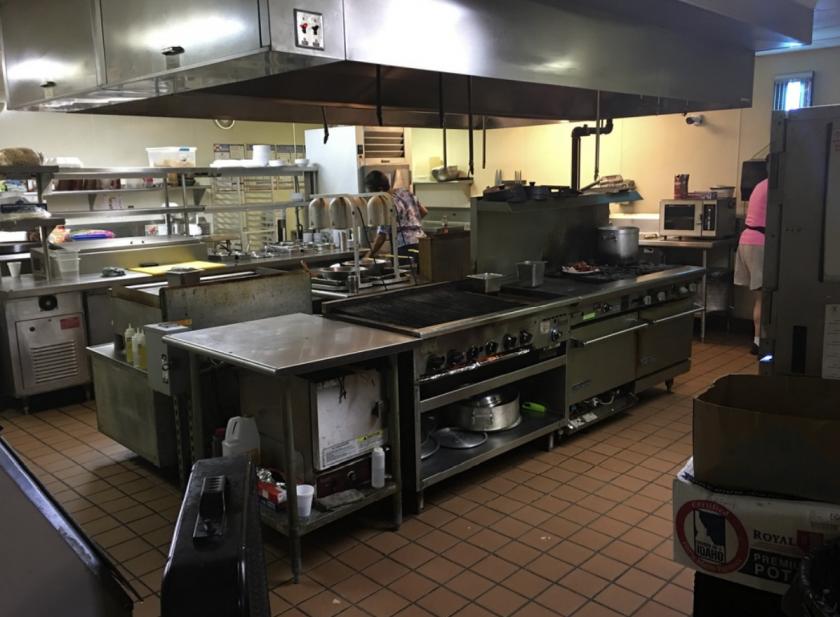
- • No Deferred Maintenance
- • Limited Nearby Food Competition
Listing Agents

Michael G. Griffin
O: 334-277-1000
M: 334-462-4446
mickey.griffin@aronov.com
O: 334-277-1000
M: 334-462-4446
mickey.griffin@aronov.com
While we strive to provide the most accurate information, all listing information, and demographic data, is provided by third-parties. As such, MyEListing will not be responsible for the accuracy of the information. It is strongly recommended that you verify all information with the listing agent, and any relevant agencies, prior to making any decisions.