Specialty Real Estate
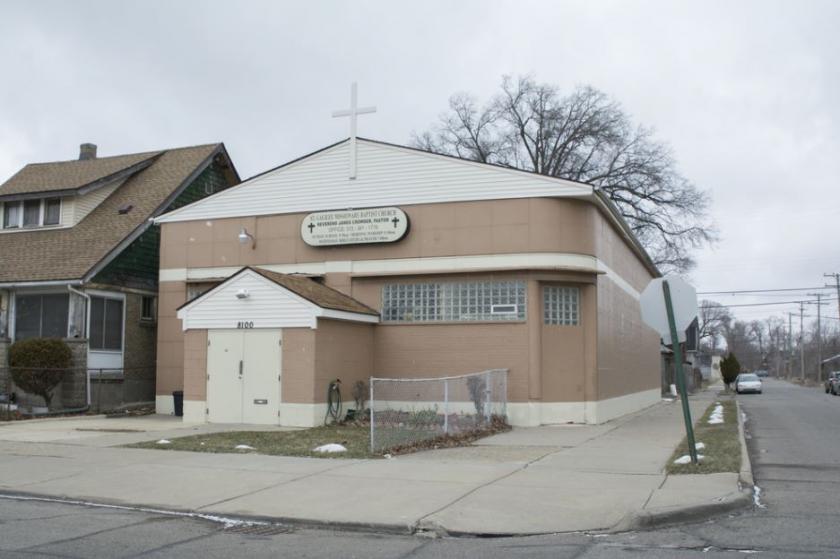
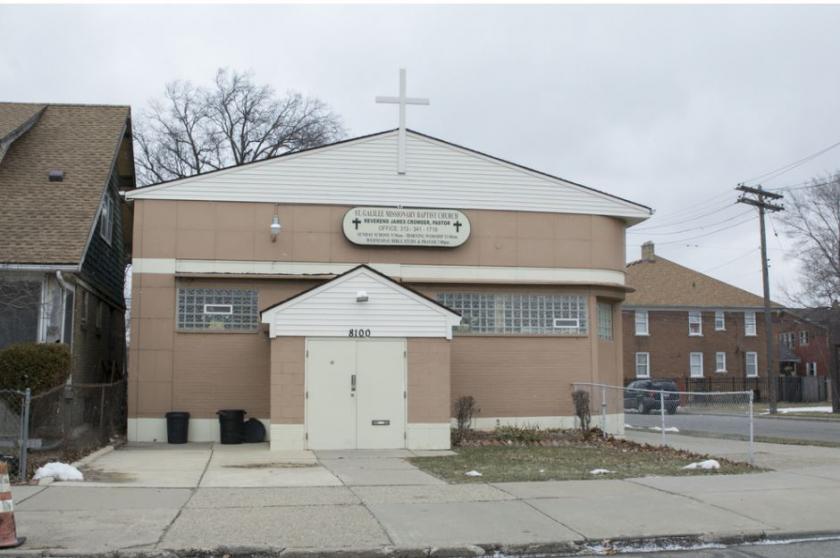
8100 Chalfonte Street Detroit, MI 48238
8100 Chalfonte Street Detroit, MI 48238
Details & Description
Property Highlights
- • 2,546 Neighborhood Church For Sale
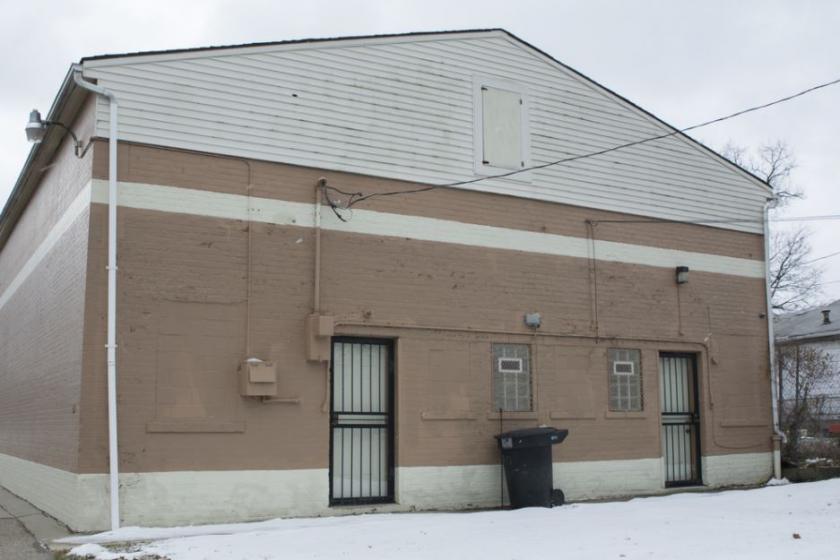
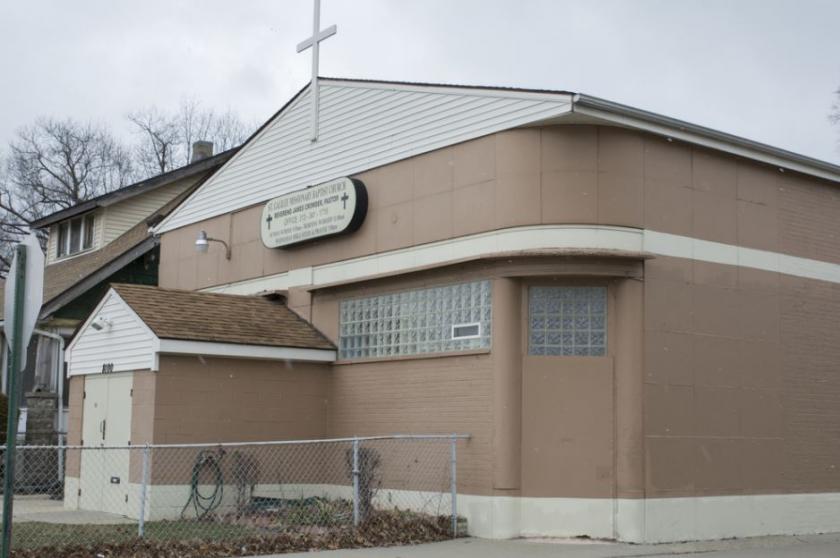
- • Clean and well maintained property
- • Sale Price $100,000
Additional Photos

Listing Agents

Brad Margolis
O: 248-351-4367
M: 248-787-0795
bmargolis@farbman.com
O: 248-351-4367
M: 248-787-0795
bmargolis@farbman.com
While we strive to provide the most accurate information, all listing information, and demographic data, is provided by third-parties. As such, MyEListing will not be responsible for the accuracy of the information. It is strongly recommended that you verify all information with the listing agent, and any relevant agencies, prior to making any decisions.


