Office Space
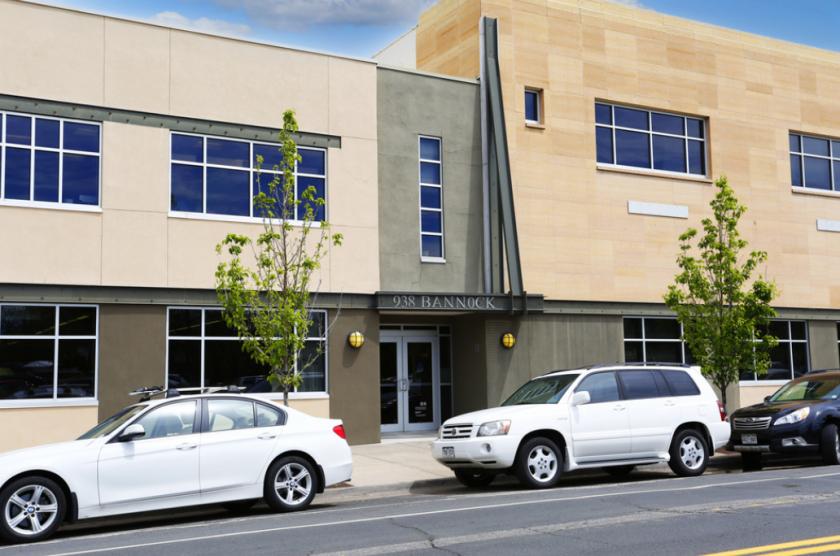
938 Bannock Street Denver, CO 80204
938 Bannock Street Denver, CO 80204
Details & Description
Property Highlights
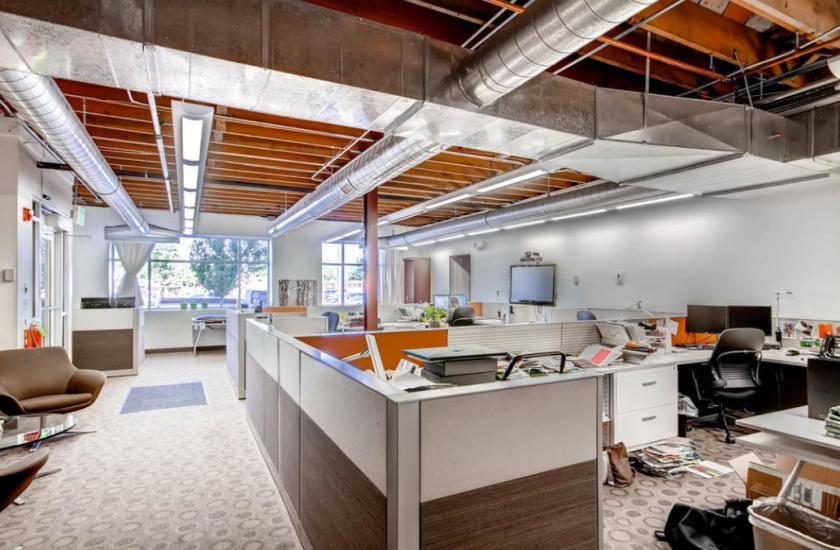
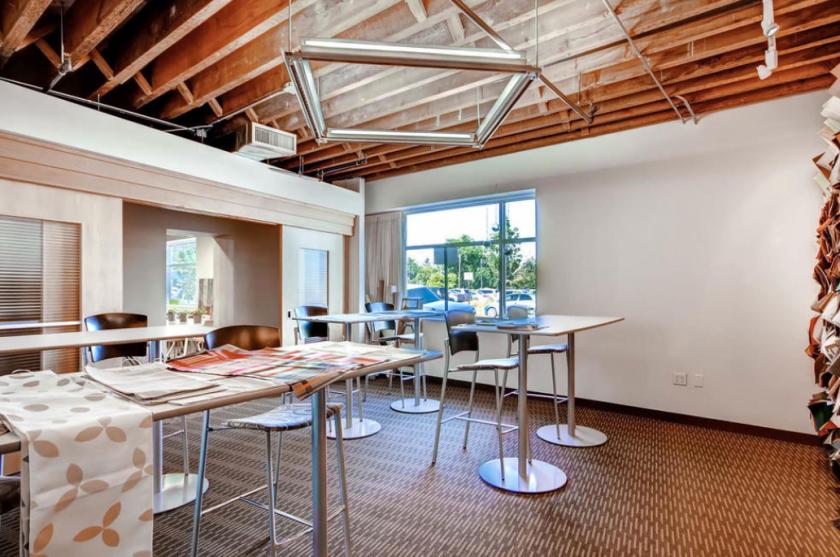
• Three 3 story 38,378 SF, divisible, loft-style office building for sublease in the heart of the Golden Triangle
• Prominent, amenity-rich location surrounded by hotels, museums, restaurants, cafes, parks and more
Additional Photos

Listing Agents

Dorit Fischer
O: 303-565-3025
M: 303-667-6873
dfischer@shamesmakovsky.com
O: 303-565-3025
M: 303-667-6873
dfischer@shamesmakovsky.com
While we strive to provide the most accurate information, all listing information, and demographic data, is provided by third-parties. As such, MyEListing will not be responsible for the accuracy of the information. It is strongly recommended that you verify all information with the listing agent, and any relevant agencies, prior to making any decisions.


