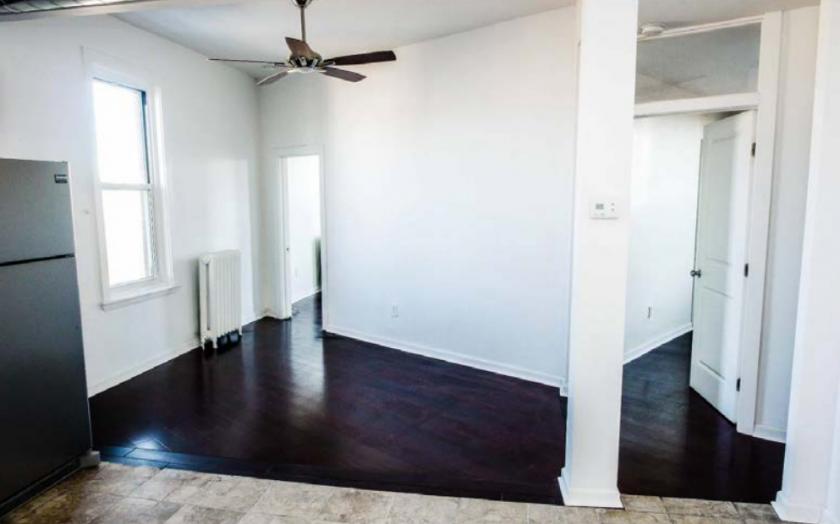
Retail Space
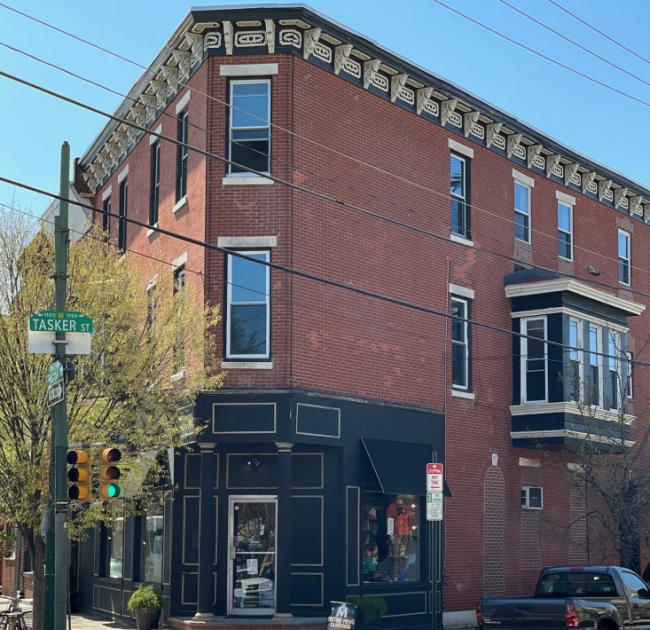
1600 East Passyunk Avenue Philadelphia, PA 19148
1600 East Passyunk Avenue Philadelphia, PA 19148
Details & Description
Property Highlights
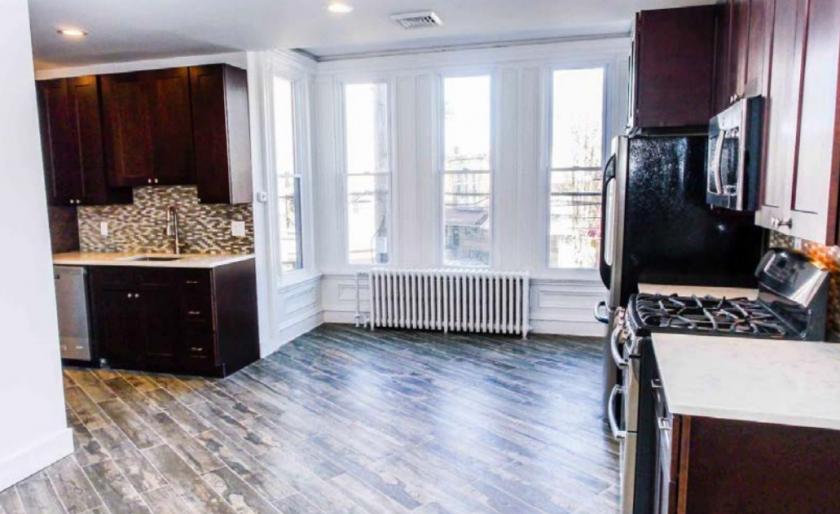
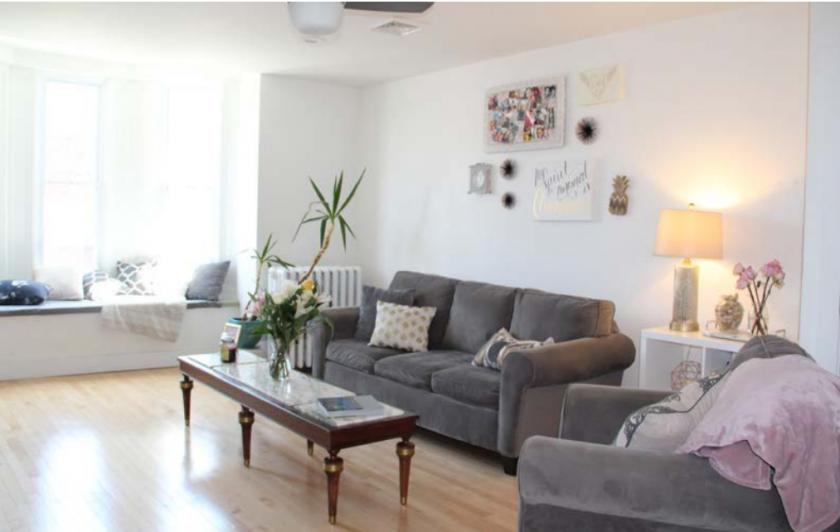
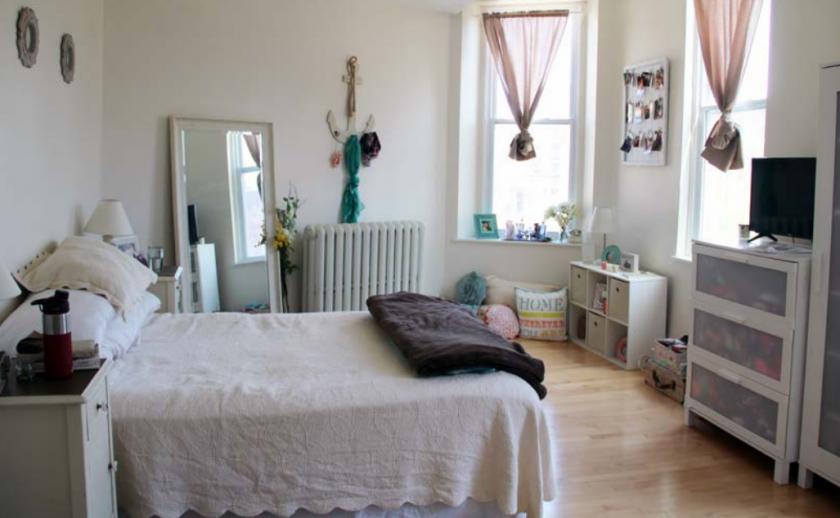
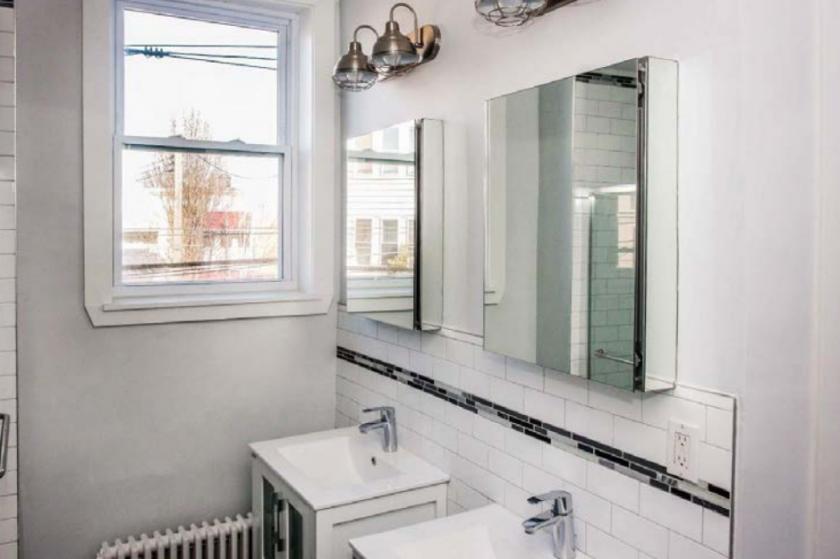
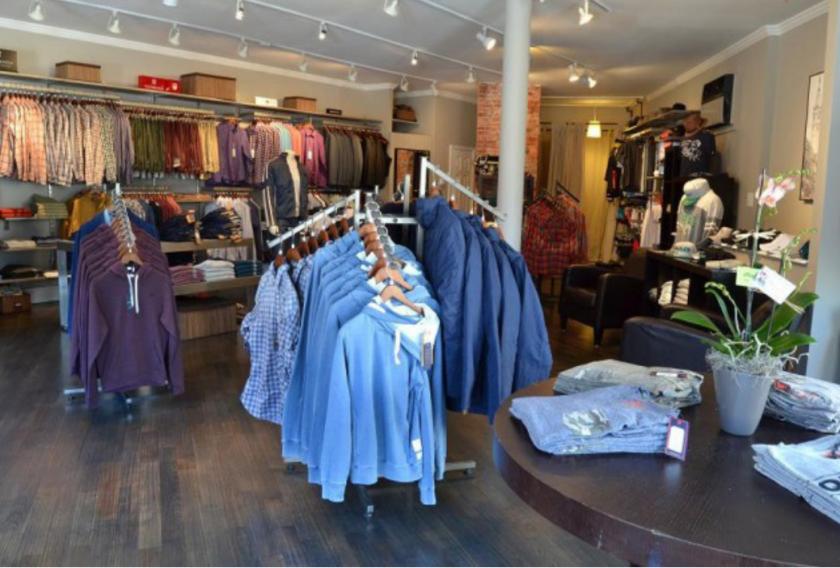
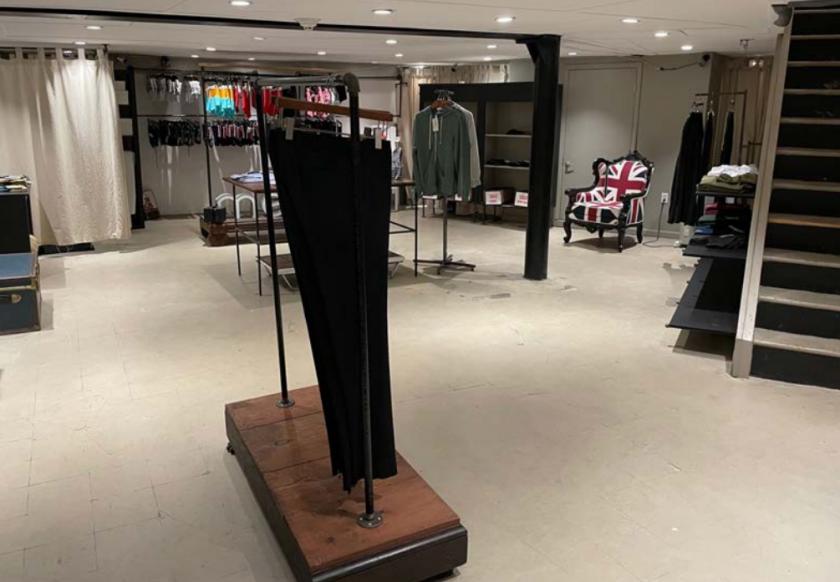
• Bi-level retail, with tremendous marketability for a variety of retail uses
• Bi-level retail, with tremendous marketability for a variety of retail uses
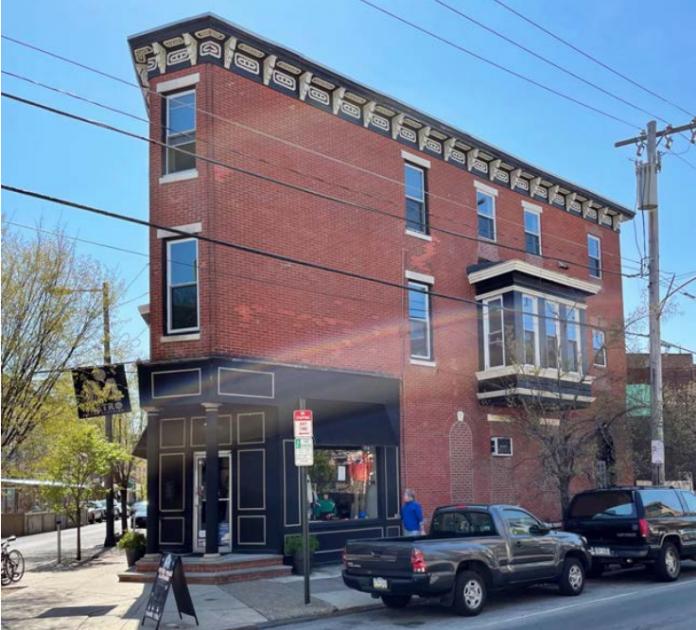
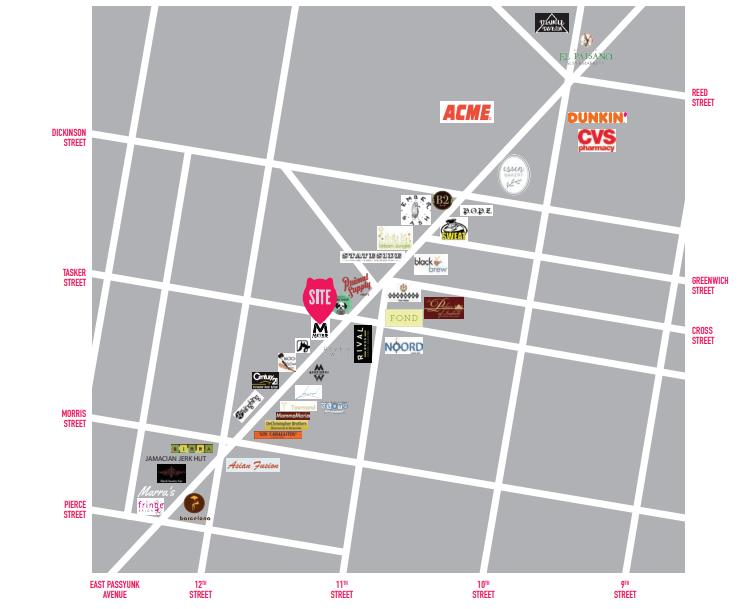
Additional Photos
Listing Agents

Vincent Stipo
O: 215-883-7399
vstipo@hellomsc.com
O: 215-883-7399
vstipo@hellomsc.com

Leah Sweitzer
MSC
O: 310-622-4532
lsweitzer@hellomsc.com
MSC
O: 310-622-4532
lsweitzer@hellomsc.com

Jacob Cooper
O: 215-568-2600
M: 215-883-7402
jcooper@hellomsc.com
O: 215-568-2600
M: 215-883-7402
jcooper@hellomsc.com
While we strive to provide the most accurate information, all listing information, and demographic data, is provided by third-parties. As such, MyEListing will not be responsible for the accuracy of the information. It is strongly recommended that you verify all information with the listing agent, and any relevant agencies, prior to making any decisions.