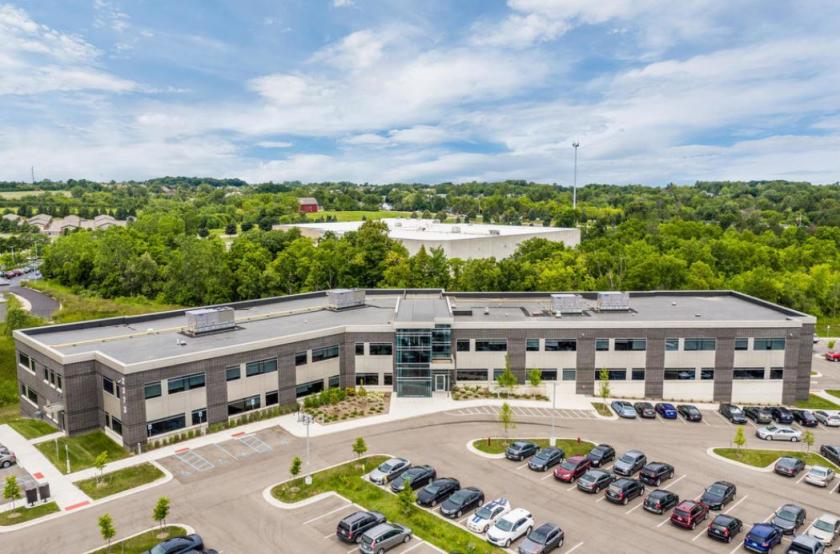
1-Mile | 3-Miles | 5-Miles | ||
---|---|---|---|---|
Total Population | 7,349 | 80,213 | 142,783 | |
Population Median Age | 39 | 34 | 35 | |
Population by Age | 0-9 Yrs | 923 (12%) | 5708 (7%) | 11346 (7%) |
10-19 Yrs | 971 (13%) | 12002 (14%) | 21841 (15%) | |
20-29 Yrs | 779 (10%) | 26500 (33%) | 41225 (28%) | |
30-39 Yrs | 1153 (15%) | 9615 (11%) | 17222 (12%) | |
40-49 Yrs | 1009 (13%) | 6859 (8%) | 13395 (9%) | |
50-59 Yrs | 964 (13%) | 7235 (9%) | 13561 (9%) | |
60-69 Yrs | 734 (9%) | 6905 (8%) | 13423 (9%) | |
70+ Yrs | 815 (11%) | 5390 (6%) | 10770 (7%) | |
Median HH Income | $109,648 | $74,277 | $74,750 | |
Total Household Income | < 24K | 236 (7%) | 6392 (20%) | 10539 (19%) |
25-49K | 293 (9%) | 4858 (15%) | 8694 (15%) | |
50-74K | 393 (13%) | 4858 (15%) | 8560 (15%) | |
75-99K | 399 (13%) | 3814 (11%) | 6151 (11%) | |
100-199K | 1198 (39%) | 8165 (25%) | 13687 (24%) | |
200K+ | 488 (16%) | 3867 (12%) | 7799 (14%) | |
Highest Education Level | No Diploma | 64 | 752 | 2139 |
Diploma or GED | 359 | 2839 | 6320 | |
Some College | 488 | 4606 | 9121 | |
Assoc. Degree | 223 | 1964 | 3920 | |
Bachelors Degree | 1605 | 14344 | 24479 | |
Higher Degree | 2414 | 19623 | 35839 | |
Total Housing Units | 3,185 | 34,280 | 59,031 | |
--Owner-Occupied | 2,228 | 15,464 | 29,067 | |
--Renter-Occupied | 778 | 16,490 | 26,364 | |
Owner-Occupied Values | < 100K | 105 | 611 | 1570 |
100-199K | 151 | 1570 | 3684 | |
200-299K | 484 | 3493 | 6624 | |
300-399K | 805 | 4089 | 6470 | |
400-499K | 494 | 2832 | 4523 | |
500K+ | 189 | 2868 | 6196 | |
Total Working Age Population | 5,864 | 71,005 | 124,415 | |
In Work Force | 4,188 | 45,401 | 78,215 | |
Not In Work Force | 1,676 | 25,604 | 46,200 | |
Workforce Employed | 4,056 | 43,667 | 75,202 | |
Workforce Unemployed | 115 | 1,712 | 2,961 | |
Civlian Workforce | 4,172 | 45,379 | 78,163 | |
Military Workforce | 16 | 22 | 52 | |
Total Households | 3,006 | 31,954 | 55,431 | |
Family Households | 2,053 | 14,181 | 27,305 | |
Non-Family Households | 954 | 17,773 | 28,126 | |
Married Couple | 1,824 | 11,826 | 22,661 | |
Other Family | 229 | 2,355 | 4,643 | |
Married w/Child | 915 | 4,818 | 9,082 | |
Single Male w/Child | 27 | 337 | 585 | |
Single Female w/Child | 99 | 750 | 1,509 |
Population Change Last Two Decades - Plus Projection
2000 | % | 2010 | % | 2020 | % | 2030 | |
---|---|---|---|---|---|---|---|
Michigan | 9,938,444 | -1 | 9,883,640 | +1 | 10,023,423 | +4 | 10,424,510 |
Washtenaw County | 322,895 | +7 | 344,791 | +9 | 376,857 | +12 | 422,684 |
Total Working Age Population:
Total Households:
Total Working Age Population:
Total Households:
Total Working Age Population:
Total Households: