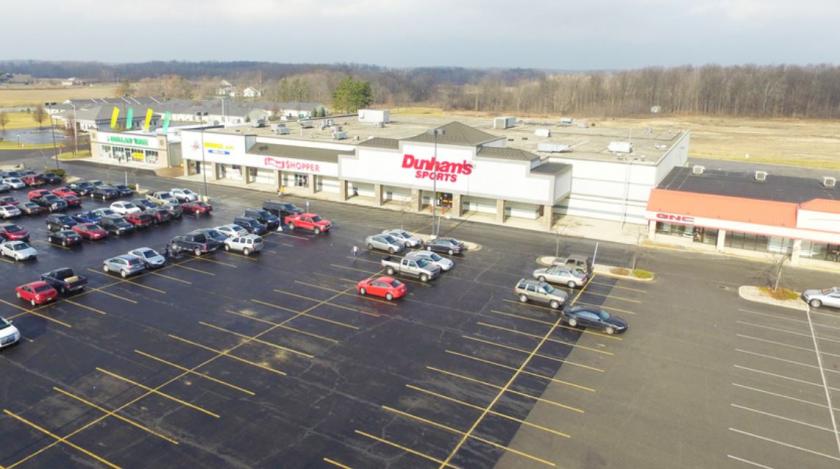
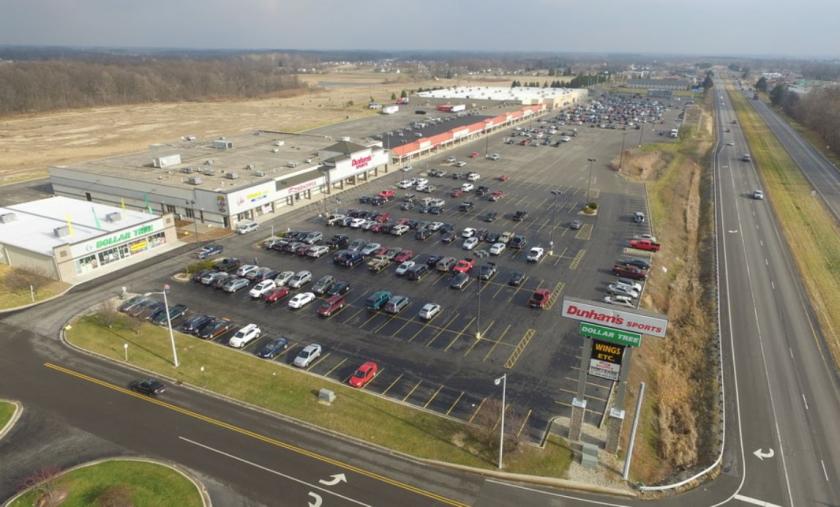
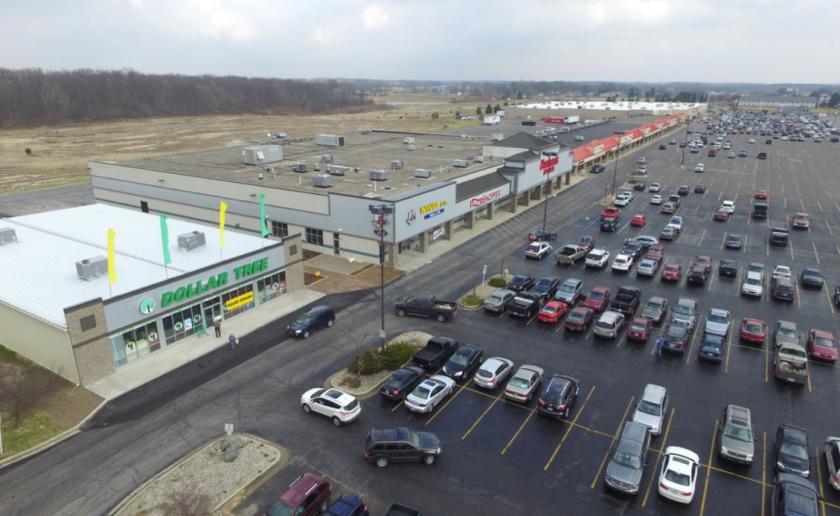
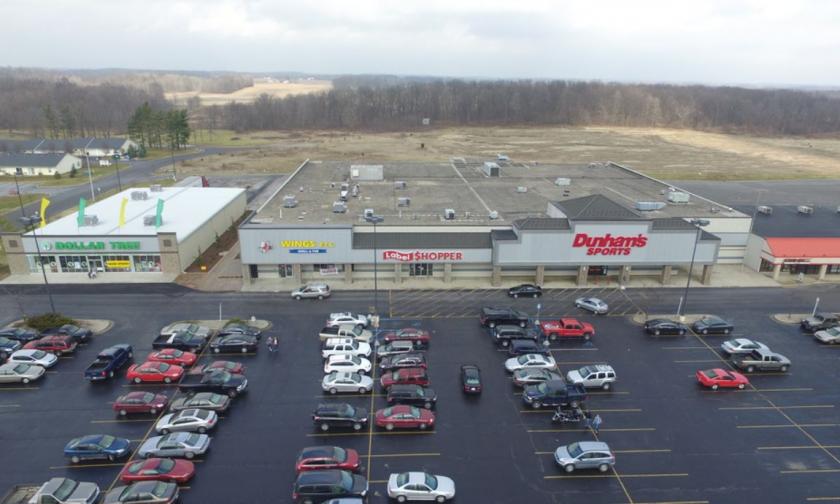
1-Mile | 3-Miles | 5-Miles | ||
---|---|---|---|---|
Total Population | 2,356 | 9,874 | 14,622 | |
Population Median Age | 39 | 39 | 40 | |
Population by Age | 0-9 Yrs | 258 (10%) | 1249 (12%) | 1887 (12%) |
10-19 Yrs | 306 (12%) | 1268 (12%) | 1760 (12%) | |
20-29 Yrs | 357 (15%) | 1372 (13%) | 1755 (12%) | |
30-39 Yrs | 354 (15%) | 1332 (13%) | 1874 (12%) | |
40-49 Yrs | 249 (10%) | 1074 (10%) | 1689 (11%) | |
50-59 Yrs | 254 (10%) | 1145 (11%) | 1865 (12%) | |
60-69 Yrs | 310 (13%) | 1326 (13%) | 2015 (13%) | |
70+ Yrs | 268 (11%) | 1108 (11%) | 1779 (12%) | |
Median HH Income | $47,509 | $51,278 | $55,016 | |
Total Household Income | < 24K | 215 (20%) | 731 (17%) | 974 (15%) |
25-49K | 374 (35%) | 1368 (31%) | 1912 (30%) | |
50-74K | 177 (16%) | 887 (20%) | 1232 (19%) | |
75-99K | 95 (8%) | 534 (12%) | 898 (14%) | |
100-199K | 166 (15%) | 609 (14%) | 1011 (16%) | |
200K+ | 28 (2%) | 155 (3%) | 219 (3%) | |
Highest Education Level | No Diploma | 183 | 598 | 861 |
Diploma or GED | 633 | 2448 | 3805 | |
Some College | 224 | 1030 | 1717 | |
Assoc. Degree | 156 | 849 | 1309 | |
Bachelors Degree | 245 | 1156 | 1636 | |
Higher Degree | 128 | 524 | 738 | |
Total Housing Units | 1,155 | 4,501 | 6,535 | |
--Owner-Occupied | 765 | 3,194 | 4,837 | |
--Renter-Occupied | 290 | 1,091 | 1,409 | |
Owner-Occupied Values | < 100K | 290 | 958 | 1268 |
100-199K | 353 | 1530 | 2297 | |
200-299K | 91 | 500 | 878 | |
300-399K | 6 | 69 | 176 | |
400-499K | 2 | 18 | 46 | |
500K+ | 22 | 119 | 173 | |
Total Working Age Population | 1,952 | 8,018 | 11,808 | |
In Work Force | 1,222 | 5,264 | 7,691 | |
Not In Work Force | 730 | 2,754 | 4,117 | |
Workforce Employed | 1,154 | 4,965 | 7,302 | |
Workforce Unemployed | 68 | 298 | 383 | |
Civlian Workforce | 1,222 | 5,263 | 7,685 | |
Military Workforce | 0 | 1 | 6 | |
Total Households | 1,056 | 4,285 | 6,247 | |
Family Households | 603 | 2,680 | 4,068 | |
Non-Family Households | 453 | 1,605 | 2,179 | |
Married Couple | 420 | 1,976 | 3,123 | |
Other Family | 183 | 704 | 944 | |
Married w/Child | 143 | 717 | 1,093 | |
Single Male w/Child | 35 | 106 | 133 | |
Single Female w/Child | 101 | 387 | 475 |
Population Change Last Two Decades - Plus Projection
2000 | % | 2010 | % | 2020 | % | 2030 | |
---|---|---|---|---|---|---|---|
Indiana | 6,080,485 | +7 | 6,483,802 | +4 | 6,738,573 | +4 | 7,014,880 |
Whitley County | 30,707 | +8 | 33,292 | +1 | 33,539 | +3 | 34,513 |
Total Working Age Population:
Total Households:
Total Working Age Population:
Total Households:
Total Working Age Population:
Total Households: