Retail Space
1086 Mantua Pike Wenonah, NJ 08090
1086 Mantua Pike Wenonah, NJ 08090
Details & Description
Property Highlights
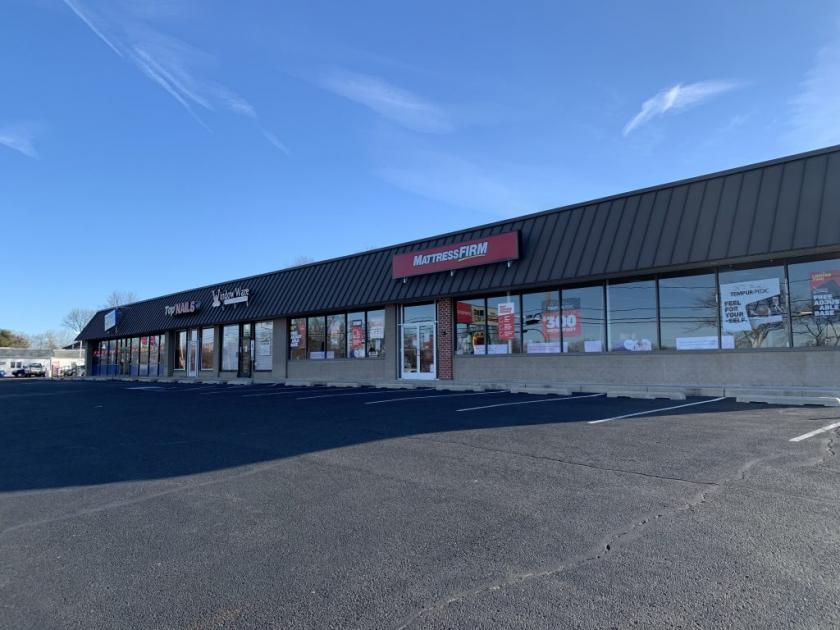
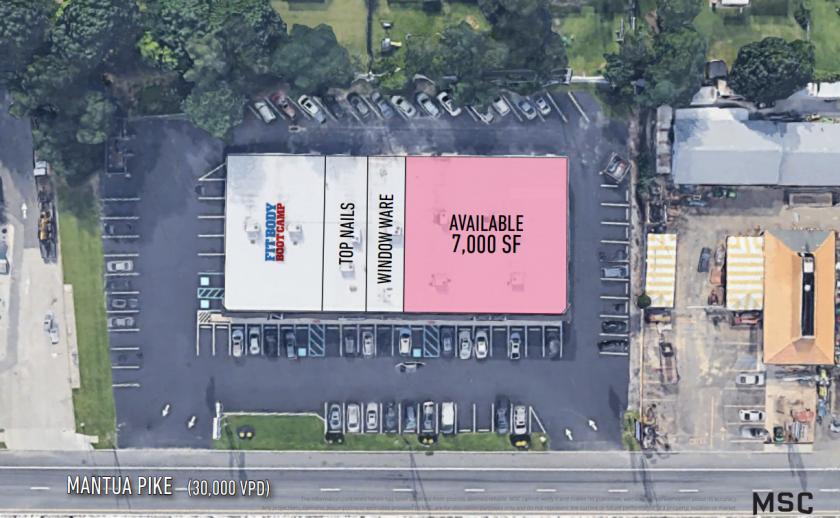
• End cap opportunity with pylon signage and ample parking
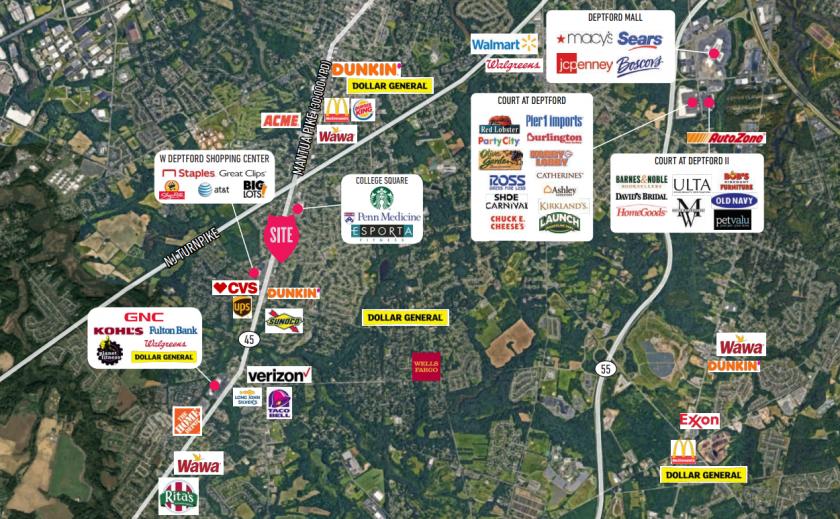
• Situated across from ShopRite anchored shopping center
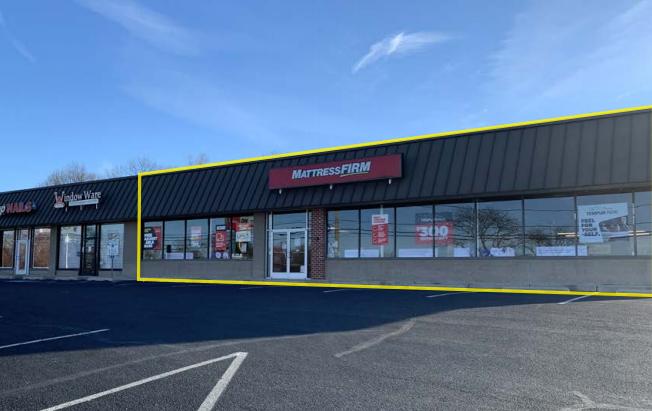
Additional Photos
Listing Agents

Scott Weiss
O: 215-883-7396
sweiss@hellomsc.com
O: 215-883-7396
sweiss@hellomsc.com

Leah Sweitzer
MSC
O: 310-622-4532
lsweitzer@hellomsc.com
MSC
O: 310-622-4532
lsweitzer@hellomsc.com
While we strive to provide the most accurate information, all listing information, and demographic data, is provided by third-parties. As such, MyEListing will not be responsible for the accuracy of the information. It is strongly recommended that you verify all information with the listing agent, and any relevant agencies, prior to making any decisions.


