Office Space
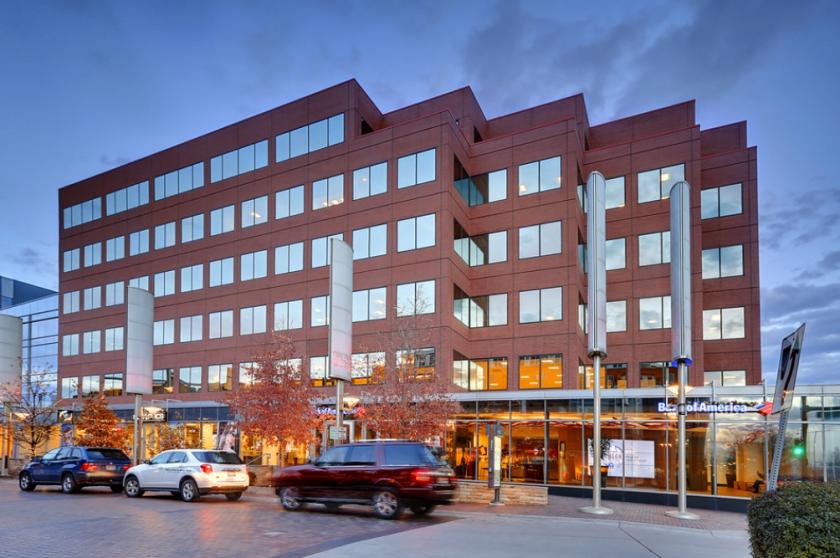
100 Fillmore Street Denver, CO 80206
100 Fillmore Street Denver, CO 80206
Details & Description
Property Highlights
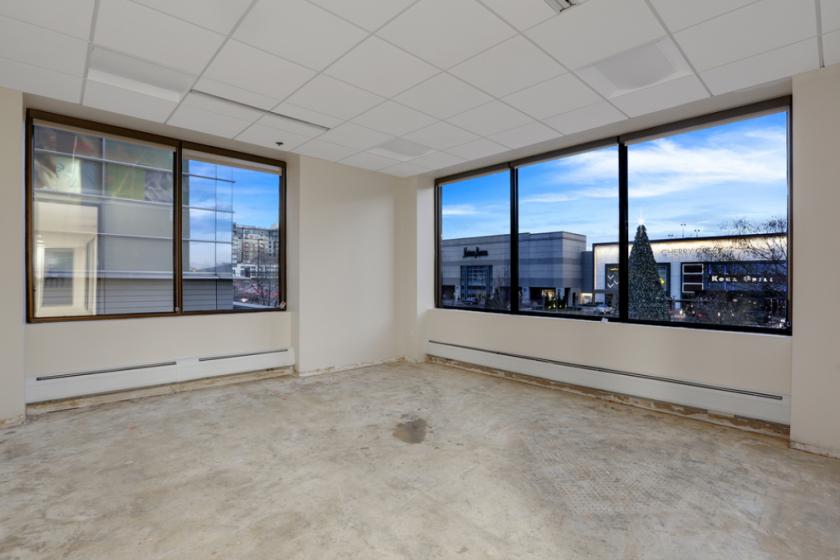
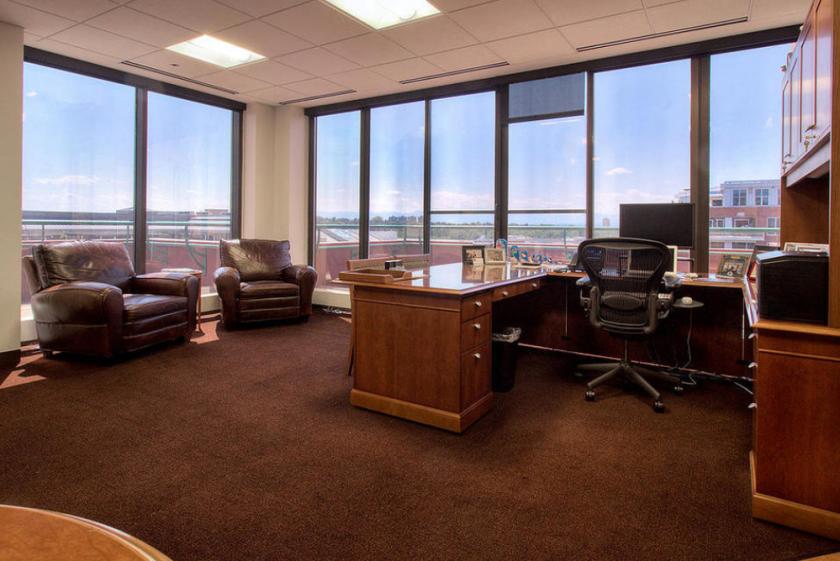
- • Mountain and city views
- • Numerous retail and dining options
- • Building signage opportunity available
- • Parking garage with reserved and unreserved spaces
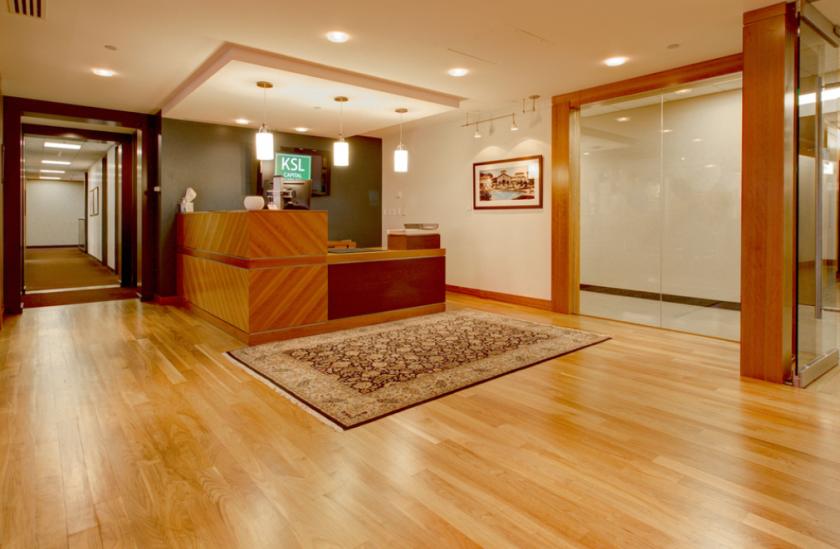
Additional Photos
Listing Agents

Ana Sandomire
O: 303-565-3029
M: 303-587-8423
asandomire@shamesmakovsky.com
O: 303-565-3029
M: 303-587-8423
asandomire@shamesmakovsky.com
While we strive to provide the most accurate information, all listing information, and demographic data, is provided by third-parties. As such, MyEListing will not be responsible for the accuracy of the information. It is strongly recommended that you verify all information with the listing agent, and any relevant agencies, prior to making any decisions.


