Retail Space
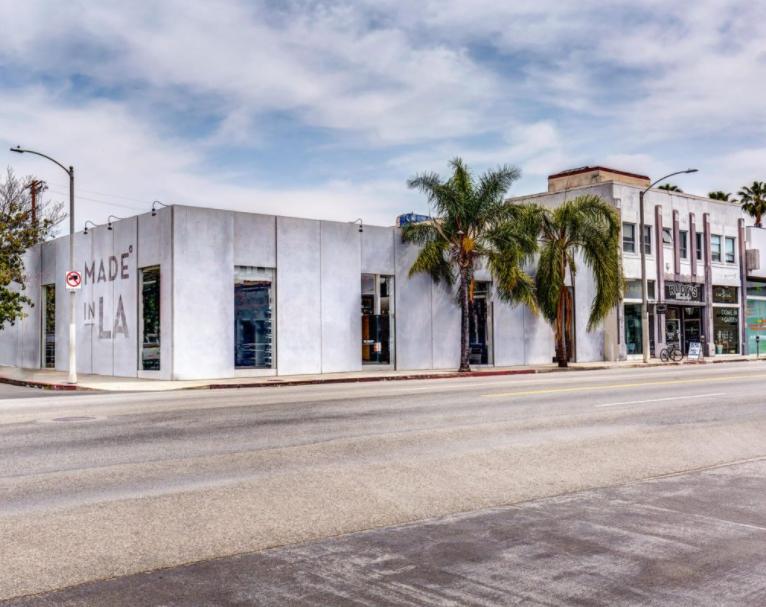
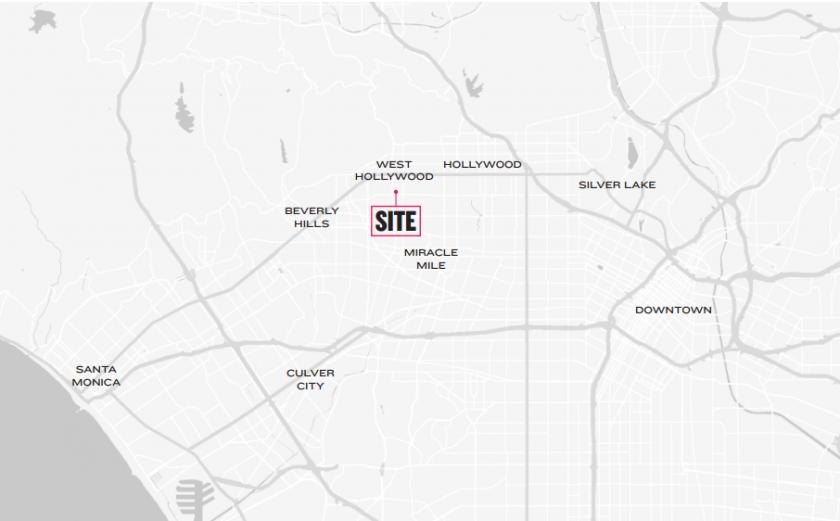
8025 Melrose Avenue Los Angeles, CA 90046
8025 Melrose Avenue Los Angeles, CA 90046
Details & Description
Property Highlights
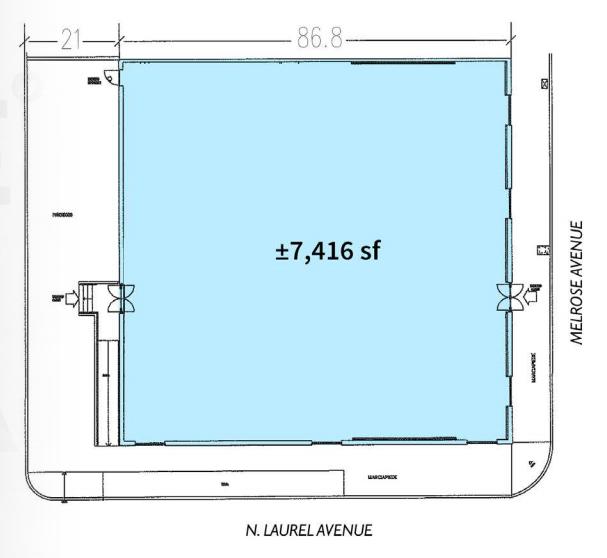
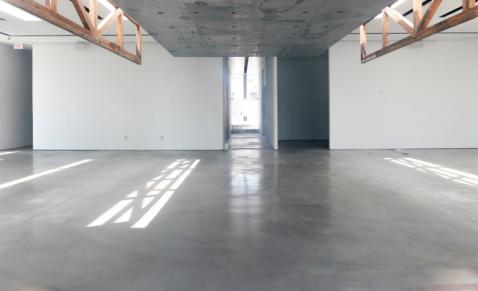
- • Approximately 7,416 SF
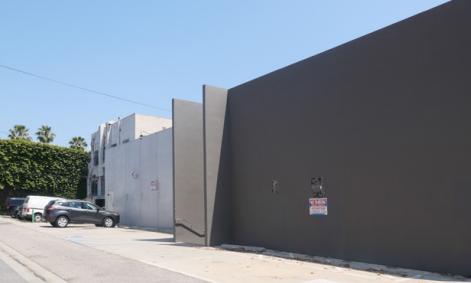
- • 5 parking spaces in rear
- • High ceilings and skylights
- • Surrounded by high street retail and dining
- • 30,000 ADT on Melrose Ave
Additional Photos


Listing Agents

Michael Salove
O: 310-622-4532
msalove@hellomsc.com
O: 310-622-4532
msalove@hellomsc.com

Leah Sweitzer
MSC
O: 310-622-4532
lsweitzer@hellomsc.com
MSC
O: 310-622-4532
lsweitzer@hellomsc.com
While we strive to provide the most accurate information, all listing information, and demographic data, is provided by third-parties. As such, MyEListing will not be responsible for the accuracy of the information. It is strongly recommended that you verify all information with the listing agent, and any relevant agencies, prior to making any decisions.