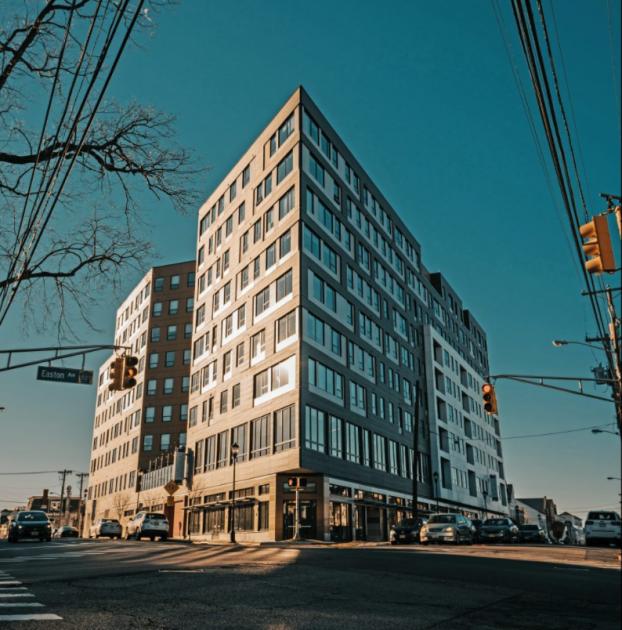
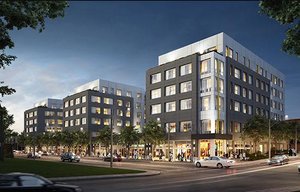
Retail/restaurant opportunities on the ground floor of a new construction mixed-use student housing project on the doorstep of Rutgers University
Comprised of 696 beds (181 units) and 8,826 SF of retail (3,720 SF available)
Close to the Amtrak and New Jersey Transit station (0.4 mi) and convention center (0.6 mi) which hosts over 14,000 conference visitors and 260 events annually
Ability to capture healthcare professionals from the surrounding medical community including St. Peter’s, Robert Wood Johnson Hospital and Rutgers New Jersey Medical School (totaling ±41,000 employees)
Walkable distance to the Johnson & Johnson Headquarters
Ready for immediate occupancy
No part of this information may be copied, reproduced, repurposed, or screen-captured for any commercial purpose without prior written authorization from MyEListing.
While we strive to provide the most accurate information, all listing information, and demographic data, is provided by third-parties. As such, MyEListing will not be responsible for the accuracy of the information. It is strongly recommended that you verify all information with the listing agent, and any relevant agencies, prior to making any decisions.
What is the building size of this commercial Retail property?
The size of this lease property at '.88 Easton Avenue.' is 3720 square feet
What kind of Retail is the propery at 88 Easton Avenue?
The property at 88 Easton Avenue New Brunswick, NJ 08901 is listed as a Other Retail Retail property
What is the population within 1 mile of 88 Easton Avenue in New Brunswick?
The population within 1 mile of 88 Easton Avenue New Brunswick, NJ 08901 is 37,556 people.
Who do I contact for questions about 88 Easton Avenue?
You should contact the listing agent,
Matthew Stein, for any details regarding this commercial listing.