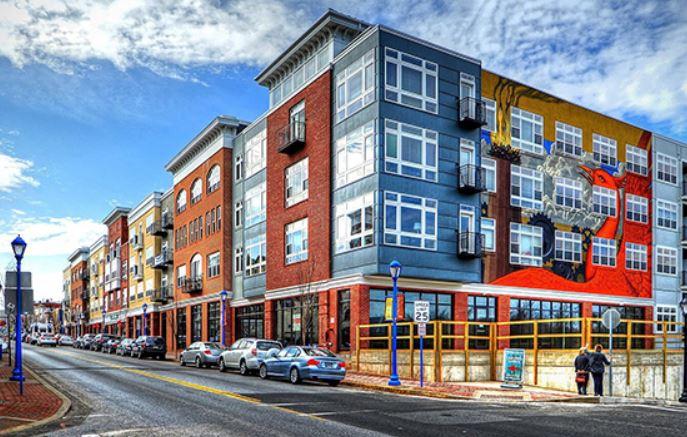
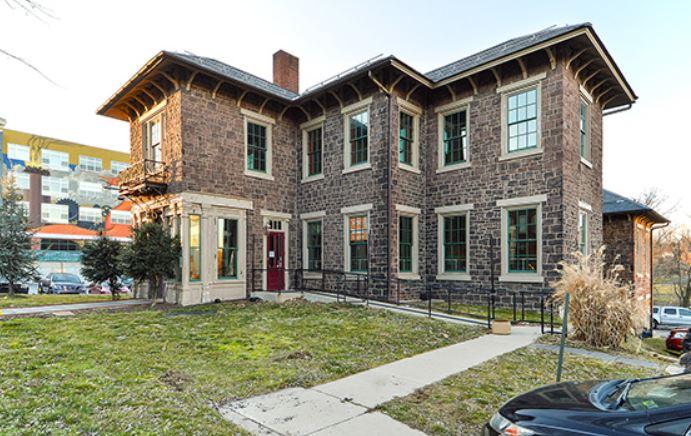
Retail Space
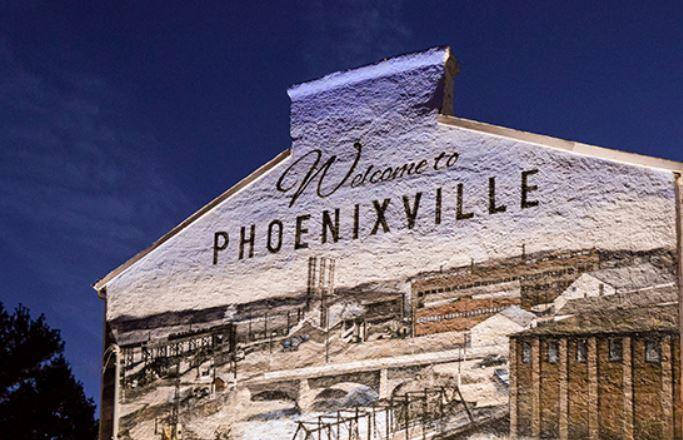
101 Bridge Street Phoenixville, PA 19460
101 Bridge Street Phoenixville, PA 19460
Details & Description
Property Highlights
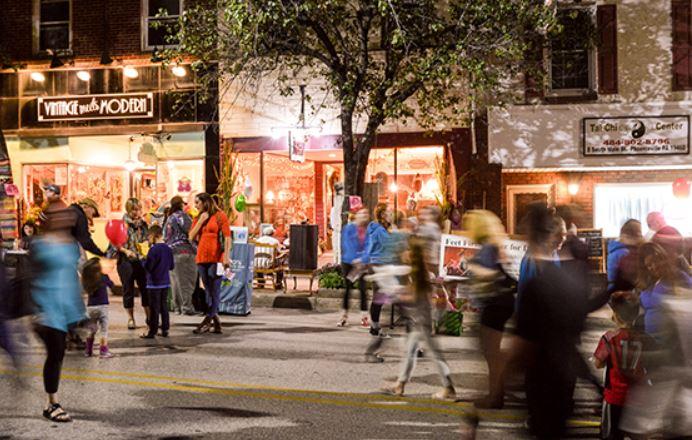
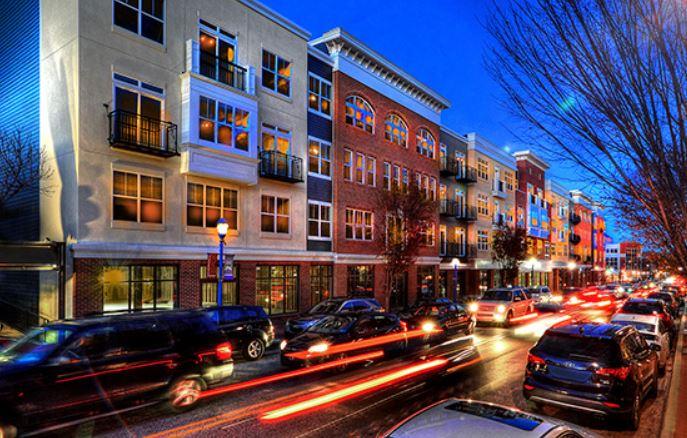
• Urban feeling, suburban downtown a liveworkplay environment in a quaint Main Street setting
• Urban feeling, suburban downtown a liveworkplay environment in a quaint Main Street setting
Additional Photos
Listing Agents

Joe Raniszewski
O: 215-883-7390
jraniszewski@hellomsc.com
O: 215-883-7390
jraniszewski@hellomsc.com

Leah Sweitzer
MSC
O: 310-622-4532
lsweitzer@hellomsc.com
MSC
O: 310-622-4532
lsweitzer@hellomsc.com
While we strive to provide the most accurate information, all listing information, and demographic data, is provided by third-parties. As such, MyEListing will not be responsible for the accuracy of the information. It is strongly recommended that you verify all information with the listing agent, and any relevant agencies, prior to making any decisions.


