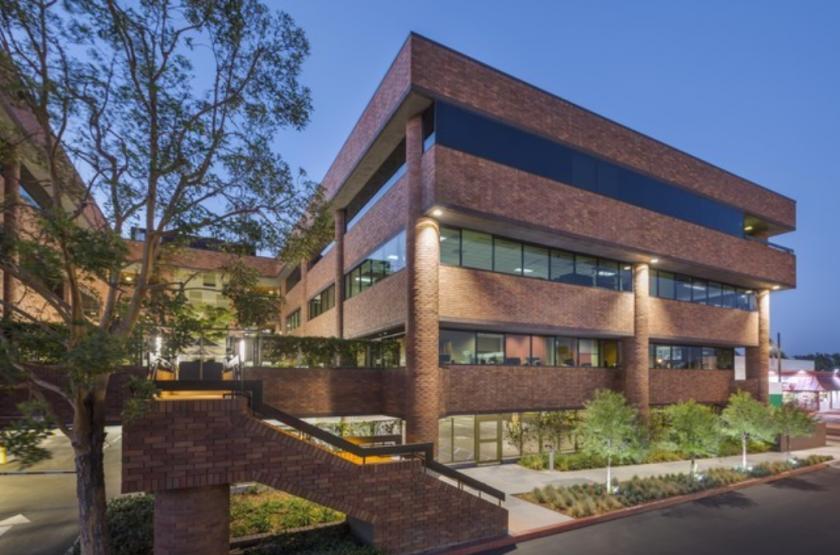
1-Mile | 3-Miles | 5-Miles | ||
---|---|---|---|---|
Total Population | 22,380 | 253,366 | 661,246 | |
Population Median Age | 40 | 39 | 40 | |
Population by Age | 0-9 Yrs | 2846 (12%) | 27830 (10%) | 71643 (10%) |
10-19 Yrs | 2516 (11%) | 24931 (9%) | 70249 (10%) | |
20-29 Yrs | 2045 (9%) | 40017 (15%) | 96180 (14%) | |
30-39 Yrs | 3321 (14%) | 40885 (16%) | 98626 (14%) | |
40-49 Yrs | 3951 (17%) | 35695 (14%) | 93349 (14%) | |
50-59 Yrs | 2815 (12%) | 31927 (12%) | 87723 (13%) | |
60-69 Yrs | 2429 (10%) | 25765 (10%) | 71346 (10%) | |
70+ Yrs | 2459 (10%) | 26316 (10%) | 72130 (10%) | |
Median HH Income | $102,169 | $75,260 | $72,026 | |
Total Household Income | < 24K | 997 (11%) | 17203 (18%) | 41452 (18%) |
25-49K | 973 (10%) | 15362 (16%) | 39753 (17%) | |
50-74K | 1198 (13%) | 14027 (15%) | 34686 (15%) | |
75-99K | 1231 (13%) | 11290 (12%) | 26734 (11%) | |
100-199K | 2616 (29%) | 23698 (25%) | 55908 (24%) | |
200K+ | 1936 (21%) | 11840 (12%) | 25483 (11%) | |
Highest Education Level | No Diploma | 589 | 27851 | 90742 |
Diploma or GED | 1151 | 30487 | 89621 | |
Some College | 2417 | 29661 | 76460 | |
Assoc. Degree | 1131 | 12294 | 32307 | |
Bachelors Degree | 5302 | 48819 | 117067 | |
Higher Degree | 5823 | 36188 | 71985 | |
Total Housing Units | 9,876 | 102,386 | 242,108 | |
--Owner-Occupied | 4,346 | 37,902 | 103,091 | |
--Renter-Occupied | 4,606 | 55,518 | 120,925 | |
Owner-Occupied Values | < 100K | 46 | 571 | 1512 |
100-199K | 89 | 312 | 1008 | |
200-299K | 32 | 760 | 1941 | |
300-399K | 106 | 2403 | 6292 | |
400-499K | 81 | 4363 | 11620 | |
500K+ | 3992 | 29493 | 80718 | |
Total Working Age Population | 17,804 | 210,830 | 548,754 | |
In Work Force | 11,985 | 139,184 | 351,897 | |
Not In Work Force | 5,819 | 71,646 | 196,857 | |
Workforce Employed | 11,366 | 132,239 | 332,162 | |
Workforce Unemployed | 620 | 6,884 | 19,542 | |
Civlian Workforce | 11,985 | 139,123 | 351,704 | |
Military Workforce | 0 | 61 | 193 | |
Total Households | 8,951 | 93,420 | 224,016 | |
Family Households | 5,531 | 57,305 | 150,772 | |
Non-Family Households | 3,420 | 36,115 | 73,244 | |
Married Couple | 4,242 | 39,693 | 103,913 | |
Other Family | 1,289 | 17,612 | 46,859 | |
Married w/Child | 2,091 | 16,163 | 41,824 | |
Single Male w/Child | 219 | 2,242 | 5,139 | |
Single Female w/Child | 440 | 4,314 | 11,455 |
Population Change Last Two Decades - Plus Projection
2000 | % | 2010 | % | 2020 | % | 2030 | |
---|---|---|---|---|---|---|---|
California | 33,871,648 | +10 | 37,253,956 | +9 | 40,467,295 | +8 | 43,631,295 |
Los Angeles County | 9,519,338 | +3 | 9,818,605 | +6 | 10,369,367 | +4 | 10,759,850 |
Total Working Age Population:
Total Households:
Total Working Age Population:
Total Households:
Total Working Age Population:
Total Households: