Commercial Land
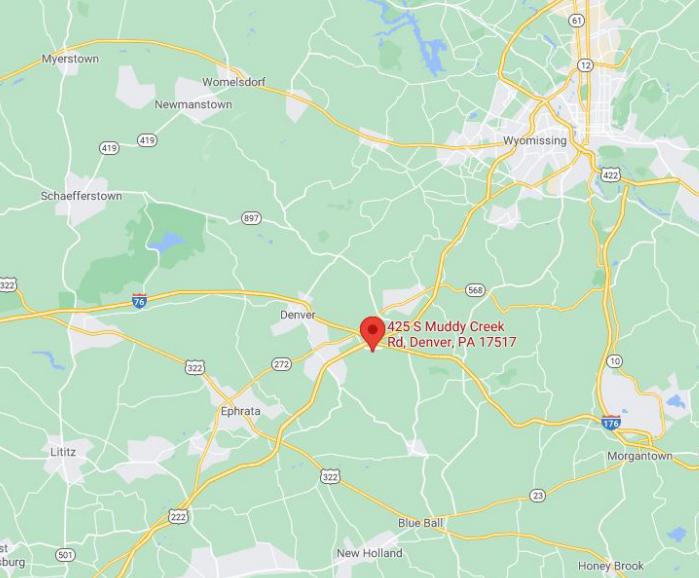
425 South Muddy Creek Road Denver, PA 17517
425 South Muddy Creek Road Denver, PA 17517
Details & Description
Property Highlights
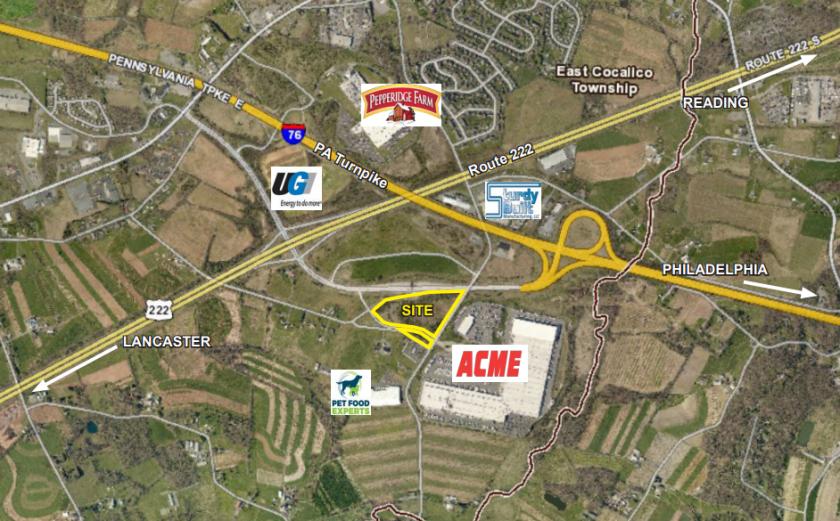
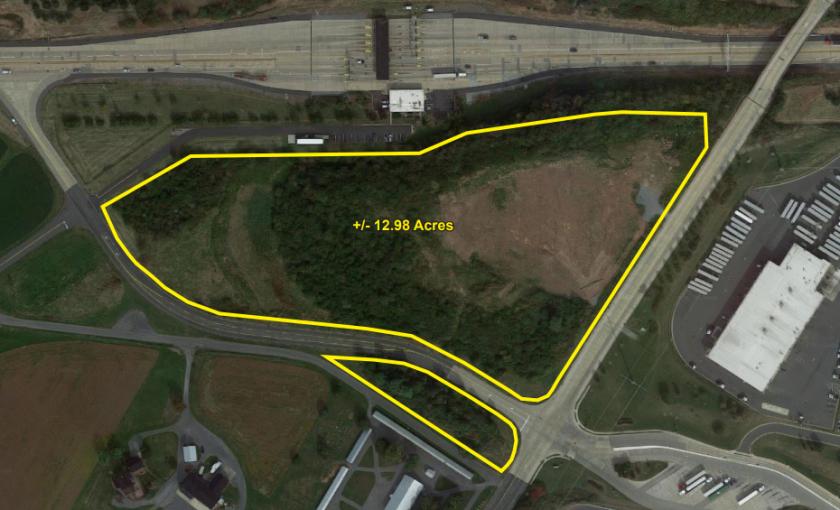
• Prime industrial site with immediate access to PA Turnpike and Route 222.
• Site was previously approved for 117,000 square foot industrial building.
Listing Agents

Scott Bradbury
O: 717-735-6000
scott@uscommercialrealty.net
O: 717-735-6000
scott@uscommercialrealty.net
While we strive to provide the most accurate information, all listing information, and demographic data, is provided by third-parties. As such, MyEListing will not be responsible for the accuracy of the information. It is strongly recommended that you verify all information with the listing agent, and any relevant agencies, prior to making any decisions.