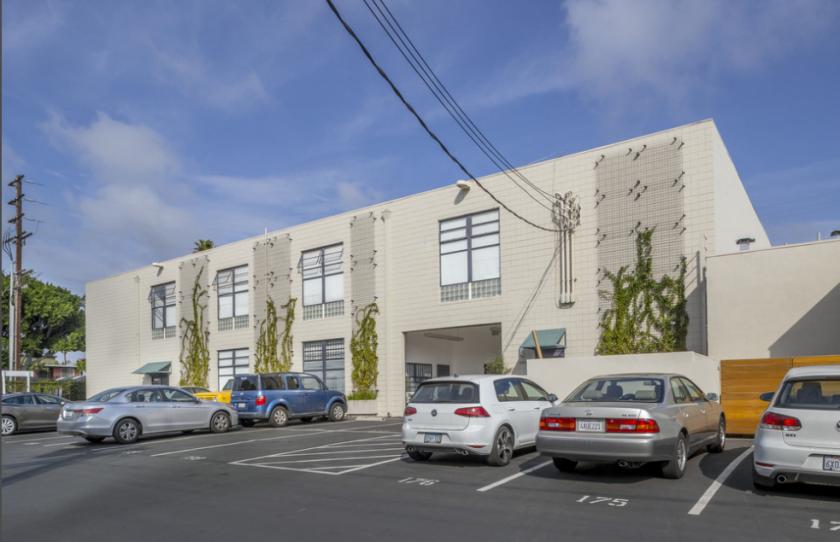
Flex-Office-Warehouse
2912 Colorado Avenue Santa Monica, CA 90404
2912 Colorado Avenue Santa Monica, CA 90404
Details & Description
Property Highlights
• Available immediately upon Landlord consent
• Term through June 30, 2022
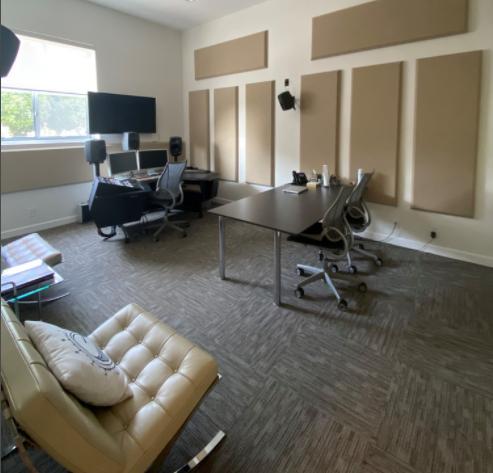
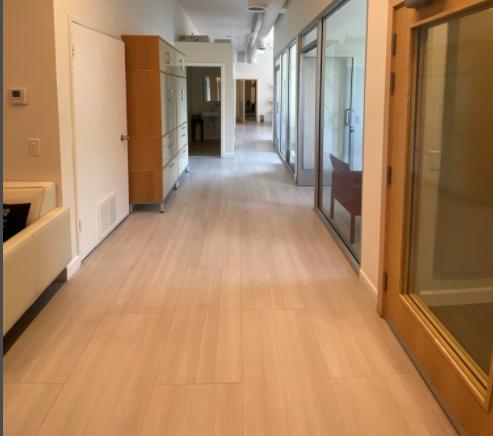
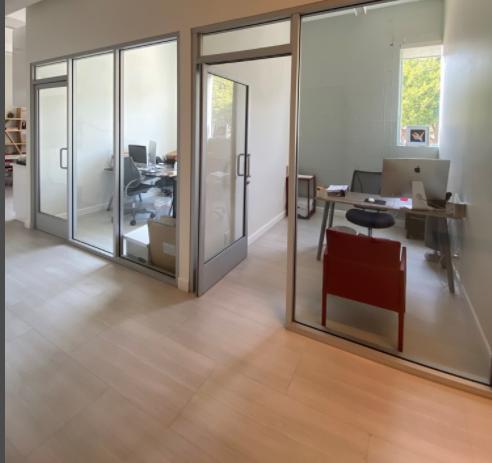
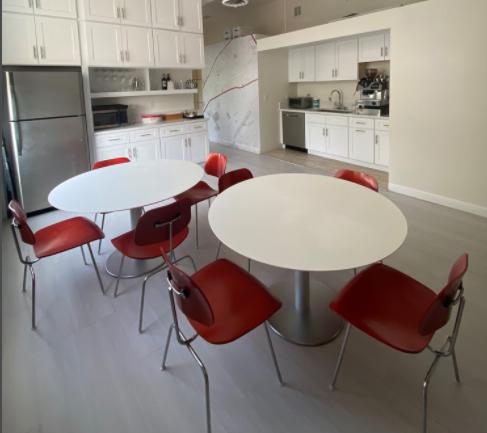
Additional Photos
Listing Agents

Michael Arnold
O: 310-806-6130
M: 310-694-4550
marnold@naicapital.com
O: 310-806-6130
M: 310-694-4550
marnold@naicapital.com
While we strive to provide the most accurate information, all listing information, and demographic data, is provided by third-parties. As such, MyEListing will not be responsible for the accuracy of the information. It is strongly recommended that you verify all information with the listing agent, and any relevant agencies, prior to making any decisions.


