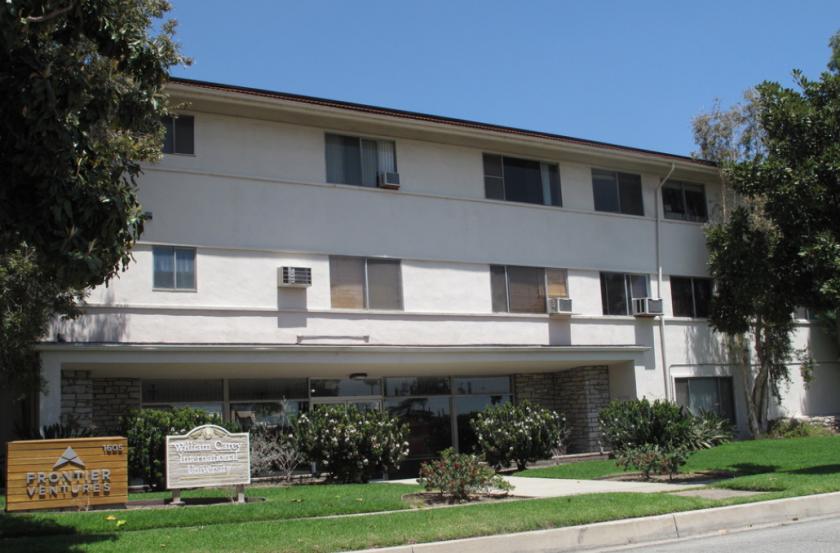
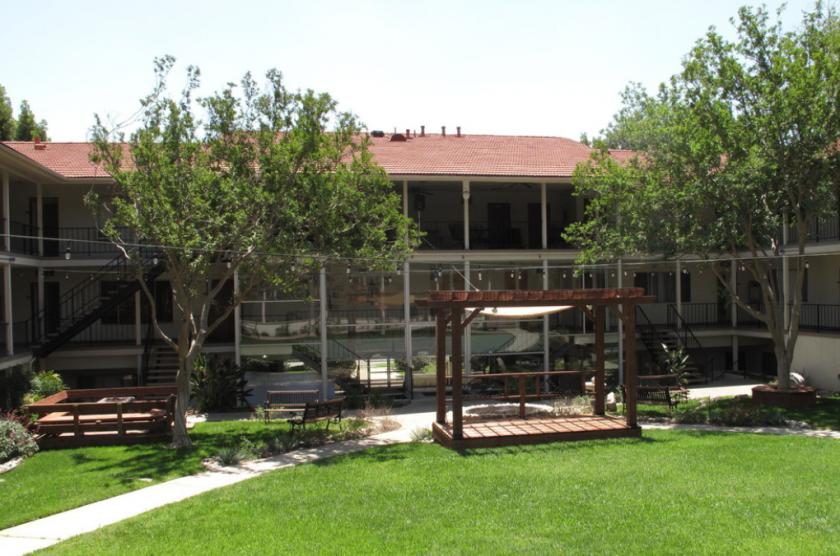
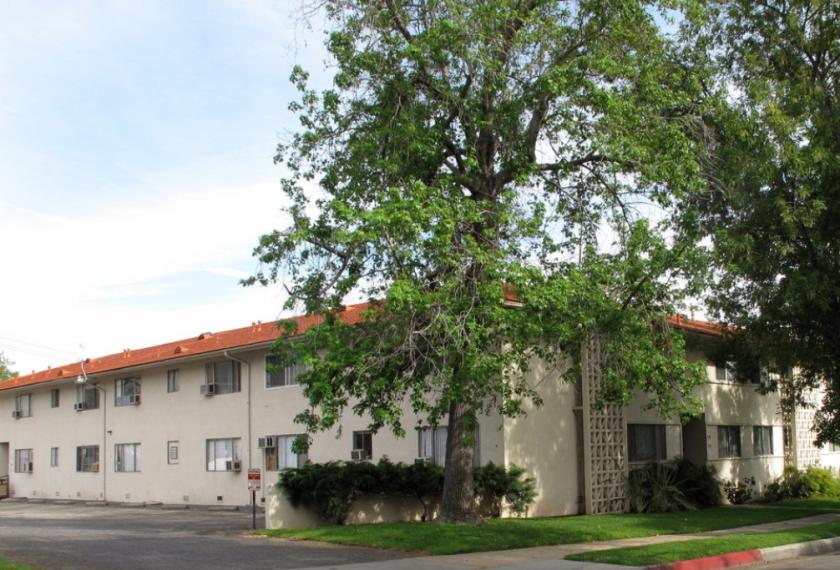
1-Mile | 3-Miles | 5-Miles | ||
---|---|---|---|---|
Total Population | 21,781 | 166,255 | 302,765 | |
Population Median Age | 43 | 40 | 41 | |
Population by Age | 0-9 Yrs | 2209 (10%) | 18745 (11%) | 34507 (11%) |
10-19 Yrs | 2056 (9%) | 15885 (9%) | 31183 (10%) | |
20-29 Yrs | 2386 (10%) | 24948 (15%) | 38056 (12%) | |
30-39 Yrs | 2327 (10%) | 25569 (15%) | 42434 (14%) | |
40-49 Yrs | 3186 (14%) | 23495 (14%) | 43901 (14%) | |
50-59 Yrs | 3748 (17%) | 22112 (13%) | 41543 (13%) | |
60-69 Yrs | 2921 (13%) | 17301 (10%) | 34737 (11%) | |
70+ Yrs | 2948 (13%) | 18200 (10%) | 36405 (12%) | |
Median HH Income | $91,321 | $82,962 | $92,517 | |
Total Household Income | < 24K | 1354 (16%) | 11271 (18%) | 17167 (15%) |
25-49K | 1162 (14%) | 8287 (13%) | 14212 (12%) | |
50-74K | 1038 (12%) | 8996 (14%) | 15088 (13%) | |
75-99K | 803 (9%) | 7788 (12%) | 13584 (12%) | |
100-199K | 2080 (25%) | 16876 (27%) | 31587 (28%) | |
200K+ | 1720 (21%) | 8851 (14%) | 20334 (18%) | |
Highest Education Level | No Diploma | 1734 | 15302 | 21503 |
Diploma or GED | 2228 | 18316 | 30058 | |
Some College | 2607 | 20634 | 34930 | |
Assoc. Degree | 1022 | 8143 | 15378 | |
Bachelors Degree | 4765 | 32133 | 65895 | |
Higher Degree | 4025 | 27086 | 54285 | |
Total Housing Units | 8,762 | 68,486 | 123,757 | |
--Owner-Occupied | 4,937 | 28,520 | 60,176 | |
--Renter-Occupied | 3,220 | 33,550 | 51,797 | |
Owner-Occupied Values | < 100K | 75 | 345 | 596 |
100-199K | 19 | 168 | 384 | |
200-299K | 16 | 298 | 522 | |
300-399K | 89 | 1341 | 1927 | |
400-499K | 285 | 2429 | 3113 | |
500K+ | 4453 | 23939 | 53635 | |
Total Working Age Population | 18,238 | 138,125 | 248,975 | |
In Work Force | 11,342 | 90,979 | 158,650 | |
Not In Work Force | 6,897 | 47,146 | 90,325 | |
Workforce Employed | 10,839 | 86,989 | 151,769 | |
Workforce Unemployed | 501 | 3,942 | 6,833 | |
Civlian Workforce | 11,340 | 90,931 | 158,602 | |
Military Workforce | 2 | 48 | 48 | |
Total Households | 8,157 | 62,069 | 111,973 | |
Family Households | 5,714 | 37,218 | 72,337 | |
Non-Family Households | 2,443 | 24,851 | 39,636 | |
Married Couple | 4,566 | 27,249 | 54,883 | |
Other Family | 1,148 | 9,969 | 17,454 | |
Married w/Child | 1,654 | 10,427 | 22,354 | |
Single Male w/Child | 136 | 937 | 1,704 | |
Single Female w/Child | 220 | 2,644 | 4,553 |
Population Change Last Two Decades - Plus Projection
2000 | % | 2010 | % | 2020 | % | 2030 | |
---|---|---|---|---|---|---|---|
California | 33,871,648 | +10 | 37,253,956 | +9 | 40,467,295 | +8 | 43,631,295 |
Los Angeles County | 9,519,338 | +3 | 9,818,605 | +6 | 10,369,367 | +4 | 10,759,850 |
Total Working Age Population:
Total Households:
Total Working Age Population:
Total Households:
Total Working Age Population:
Total Households: