Retail Space
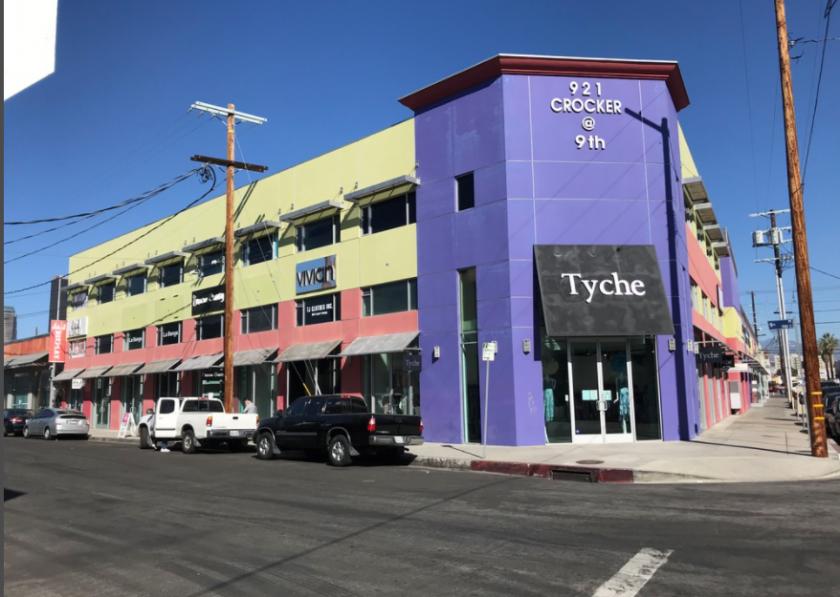
921 Crocker Street Los Angeles, CA 90015
921 Crocker Street Los Angeles, CA 90015
Details & Description
Property Highlights
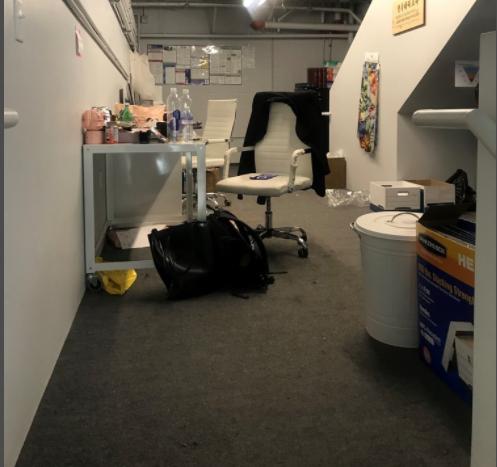
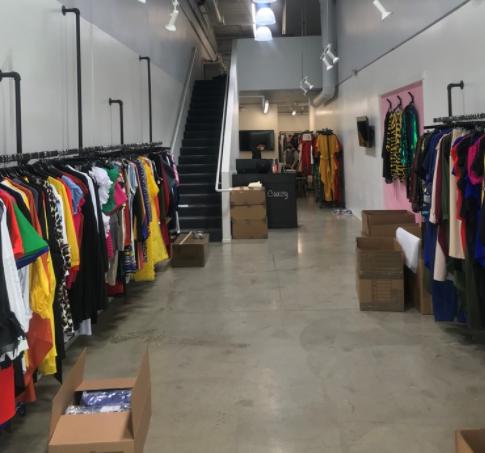
- • Showroom Creative Office Space
- • Ground Floor Retail Frontage with mezzanine
- • Elevator Serviced Rooftop Parking
- • Within Enterprise Zone
Listing Agents

Tracy Taft
O: 213-632-7718
ttaft@naicapital.com
O: 213-632-7718
ttaft@naicapital.com
While we strive to provide the most accurate information, all listing information, and demographic data, is provided by third-parties. As such, MyEListing will not be responsible for the accuracy of the information. It is strongly recommended that you verify all information with the listing agent, and any relevant agencies, prior to making any decisions.